
Gold Kiwi 1oz Coin Special -30 Gone50 x 1oz NZ Mint 99.99% Gold Kiwi Coins left.
Good condition (no scratches) and various years but not in individual plastic wrapping or casings. Normally priced at Spot + 5.7% at NZ Mint. Selling 1-9 coins at Spot plus 5% (Approx $1796) Selling 10-28 coins at Spot + 4% (Approx $1779) Selling 29+ coins at Spot plus 3% (Approx $1762) Get in fast as there’s only 50 in stock! Ph 0800 888 465 and speak to David or reply to this email. |

This Week:
- NZD Silver May Have Broken Out of 4 Year Downtrend
- Does New Zealand Have Too Much Overseas Debt?
- Bond Fund Manager Worried About “Systemic Event”
- Gold, Debt and a (Northern) Summer Rebound?
Prices and Charts
| Spot Price Today / oz | Weekly Change ($) | Weekly Change (%) | |
|---|---|---|---|
| NZD Gold | $1712.31 | – $12.30 | – 0.71% |
| USD Gold | $1175.50 | – $10.00 | – 0.84% |
| NZD Silver | $23.18 | – $0.27 | – 1.15% |
| USD Silver | $15.91 | – $0.21 | – 1.30% |
| NZD/USD | 0.6865 | – 0.0009 | – 0.13% |
Bit of a slow news this week in gold and silver land, so unless inspiration strikes us today’s email might be brief.
Both metals did jump higher at the start of the week but have since pulled back sharply overnight. According to this Zerohedge piece:
“someone decided it was an appropriate time to dump over half a billion dollars of notional gold on the futures market…
Seems normal… dump it all at once, flush the stops, and now prices are rising once again.”
So more shenanigans as we’ve seen this multiple times in recent years.
(Note: There’s a link within the article to another Zerohedge article from earlier this week with news of exactly who caused the gold price flash crash from January 2014.)
You can see in the chart below NZD gold moved quite sharply higher over the past week. But has since pulled back about $50 an ounce.
With the Kiwi dollar looking due a bounce (more on that soon), we might see the local gold price pull back a bit further yet. See the 2 red arrows in the chart for possible “buy zones”.
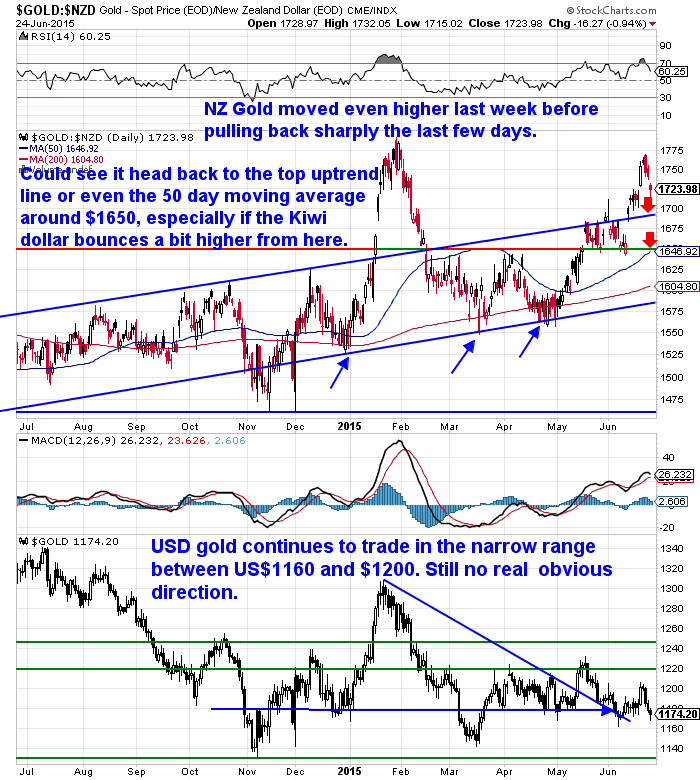
NZD silver also got up towards the upper bounds of its higher trending trading range this week. Like gold it too has since pulled back and could go a bit lower yet perhaps.
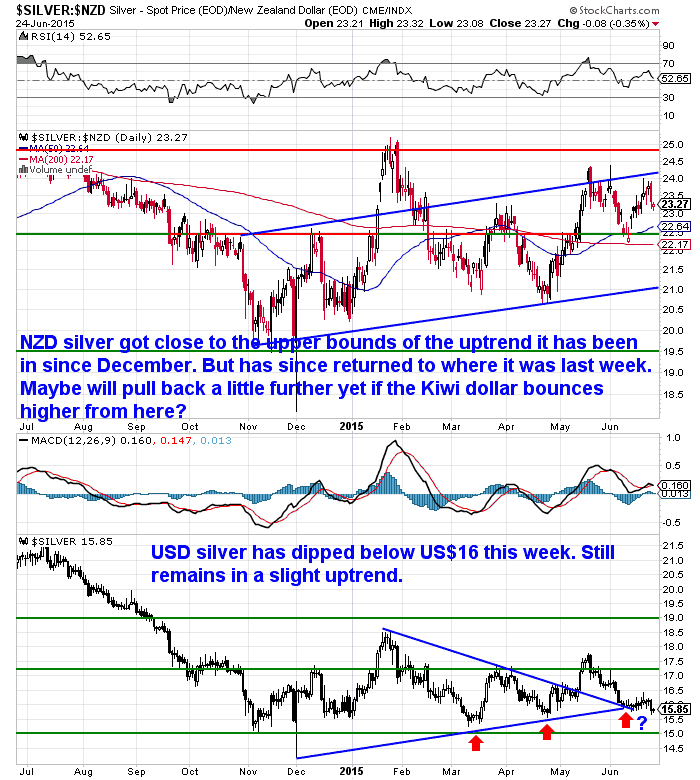
NZD Silver May Have Broken Out of 4 Year Downtrend
It’s worth casting your eye at a longer term view of silver (taken from today’s daily price alert which you can get access to here if you’re looking to buy and want to keep a close eye on prices).
NZD Silver looks mighty close to having broken out of the 4 year downtrend it has been in. So that could well be a positive sign and might make these levels a potentially low risk entry point to buy.
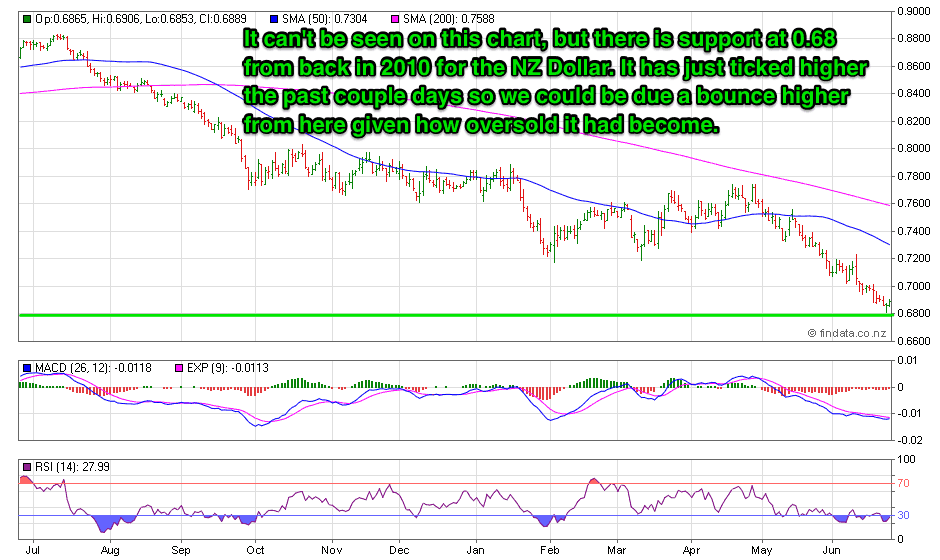
As mentioned the Kiwi Dollar has just edged a tad higher the past 2 days.
The chart below doesn’t show it but the 0.6800 level has reasonable support from back in 2010. So this could be the start of a bounce higher – in the short term anyway. The 0.6500 level still looks a likely destination to be reached before long though. But in the short term a higher dollar could mean cheaper gold and silver prices for NZ buyers.
—– OFFER FROM OUR SISTER COMPANY: Emergency Food NZ —–
** Urgent Message for All Car Owners **
A compact, revolutionary tool can save your life.
We believe everyone who drives or rides in a vehicle must carry this tool.

The Keychain Car Escape Tool can save lives.
For less than the price of 2 movie tickets you can get 2 of these. One for each car in your family or give one to someone you care about.
Click here to get yours now – with FREE shipping.
—–
Does New Zealand Have Too Much Overseas Debt?
We mentioned last week how New Zealand’s ongoing current account deficit means we have to borrow from offshore to fund our lifestyle.
Well, over the weekend we spotted an article from Brian Gaynor looking at the latest numbers released on NZ’s international investment position. We were glad to see this as it saved us trawling through the Statistics ourselves! Instead we can just comment on them.
They certainly back up what we were saying last week.
We already knew that NZ household debt as a percentage of nominal disposable income is over 160%.
But another telling number is our gross external debt as a percentage of GDP (Gross external debt is how much we owe both public and private to offshore holders of our debt).
This is now 103%. That means we owe a touch more than our whole Gross National Product to lenders based outside of New Zealand.
This further reinforces the point that New Zealand requires a big wad of money to keep coming into the country to fund the fact that we consume more than we save.
Here’s some of the numbers from the article:
“While New Zealand’s Crown debt/GDP ratio of 38 per cent is low by international standards, our gross external debt/GDP ratio of 103 per cent is high. The reason for this is that we have relatively small capital markets and borrowers have to rely on overseas funding.
By contrast Japan, has a government debt/GDP ratio of 232 per cent and a gross external debt/GDP ratio of only 55 per cent. The latter figure is low because the Japanese Government is able to source a high proportion of its borrowing from domestic lenders through the country’s capital market.
These New Zealand and Japanese figures illustrate that we have to look at the size of a country’s capital markets, and the ability of borrowers to raise money onshore, when assessing overall debt situations.
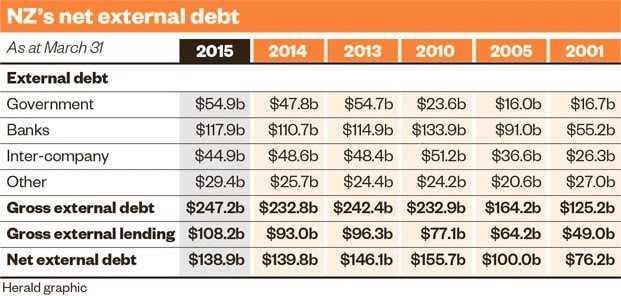
The author Brian Gaynor comments on how banks have reduced their reliance on overseas funding since 2008. You can see this in the table above with the figures dropping from 2010 to 2014.
However we note that this year the figured jumped back up by $7 billion.
While one data point does not a trend make, it’s possible the buoyant housing market is requiring the banks to borrow more from offshore.
As we have pointed out in the past, while we have low government debt comparatively to other developed nations, the risk NZ faces is our high level of private debt and the requirement to borrow this offshore. Brian Gaynor also concludes with this statement:
“…a big issue is the small size of New Zealand’s financial markets and the requirements of domestic borrowers to source a high percentage of their debt from overseas lenders.
The New Zealand economy would be in a much stronger position if domestic borrowers could source most of their borrowings from domestic lenders through the country’s financial markets.”
A market shock could well have a significant impact if credit markets were to freeze up as they almost did in 2008.
Bond Fund Manager Worried About “Systemic Event”
According to the UK Telegraph the manager of one of Britain’s biggest bond funds is worried about just such an “event” happening…
“The manager of one of Britain’s biggest bond funds has urged investors to keep cash under the mattress.Ian Spreadbury, who invests more than £4bn of investors’ money across a handful of bond funds for Fidelity, including the flagship Moneybuilder Income fund, is concerned that a “systemic event” could rock markets, possibly similar in magnitude to the financial crisis of 2008, which began in Britain with a run on Northern Rock.“Systemic risk is in the system and as an investor you have to be aware of that,” he told Telegraph Money.
The best strategy to deal with this, he said, was for investors to spread their money widely into different assets, including gold and silver, as well as cash in savings accounts. But he went further, suggesting it was wise to hold some “physical cash”, an unusual suggestion from a mainstream fund manager.”
We’d say a mainstream fund manager recommending gold and silver is even more unusual!
Particularly in times where sentiment towards gold and silver is as low as it is.
More Signs of Terrible Sentiment Towards Gold
Speaking of low sentiment. We’ve noticed more and more articles like the following one of late…
“Finding bullish gold investors is getting a lot harder, even in a place where demand has been almost a given in recent years: precious-metal coins.
Customers who were buying even as gold began slumping in 2013 are now so scarce at the Bullion Trading LLC shop in New York that owner Isaac Kahan says sales in May tumbled 35 percent. Purchases of American Eagle gold coins from the U.S. Mint, the world’s largest, were the weakest for the month in eight years…
“What we are seeing is complete capitulation,” said Rob Haworth, a senior investment strategist in Seattle at U.S. Bank Wealth Management, which oversees about $128 billion and is underweight in commodities, including gold. “Physical demand is very weak, and that lends to our expectations of lower prices.”
However if you think about it, the last part of Mr Haworth’s comments doesn’t really make sense.
Why’s that?
Because if you get a “complete capitulation”, it usually means that anyone who wanted to sell has already sold.
So when there is no one left to sell, it should mean that buyers will appear. And if no one is left to sell, then prices will have to rise in order to attract sellers.
If there has been a “complete capitulation” then that would more likely mean the gold bear market is finally over.
Who knows if there has been “complete capitulation” yet? If it hasn’t, we must certainly be close to it if.
Gold, Debt and a Summer Rebound?
We were going to finish there, but then remembered this Frank Holmes article from earlier this week. A complete capitulation rebound might well tie in nicely with an historical (Northern Hemisphere) summer rebound.
But first he takes an interesting look at gold in terms of total global debt…
By Frank Holmes“Ever wonder how much gold has ever been exhumed in the history of the world? The GFMS Gold Survey estimates that the total amount is approximately 183,600 tonnes, or 5.9 billion ounces. If we take that figure and multiply it by the closing price on June 16, $1,181 per ounce, we find that the value of all gold comes within a nugget’s throw of $7 trillion.This is an unfathomably large amount, to be sure, yet it pales in comparison to total global debt.According to management consulting firm McKinsey & Company, the world now sits beneath a mountain of debt worth an astonishing $200 trillion. That’s greater than twice the global GDP, which is currently $75 trillion. If we were to distribute this amount equally to every man, woman and child on the face of the earth, we would each owe around $28,000.More surprising is that if gold backed total global debt 100 percent, it would be valued at $33,900 per ounce.
Try convincing your gold dealer of this next time you want to sell a coin…
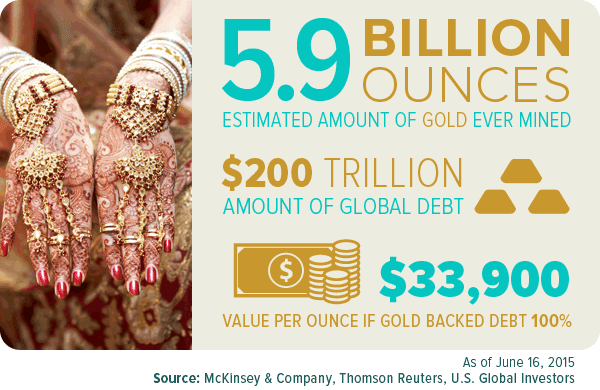
It’s unlikely that gold will ever reach $33,900 per ounce—or even $12,000, as investing expert James Turk calculates—but the fact that supply has not kept up with debt levels suggests that prices might very well rise.
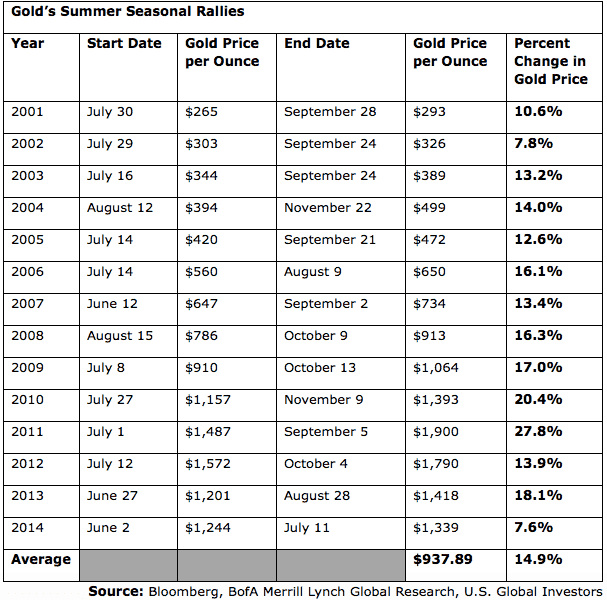
Gold’s Late Summer Rebound Trend
A new report by Bank of America Merrill Lynch shows that since 2001, bullion has reached a bottom between mid-June and mid-July and rebounded thereafter. In all but two of the last 27 years, or 93 percent of the time, gold and gold equities enjoyed a late summer rally, thanks in large part to the approaching Indian festival and wedding seasons.
This helps confirm what I often write and speak about, that gold prices have historically followed seasonality trends for the five-, 15- and 30-year periods. You can see how gold troughed between June and July and then rose in anticipation of Diwali and the wedding season.
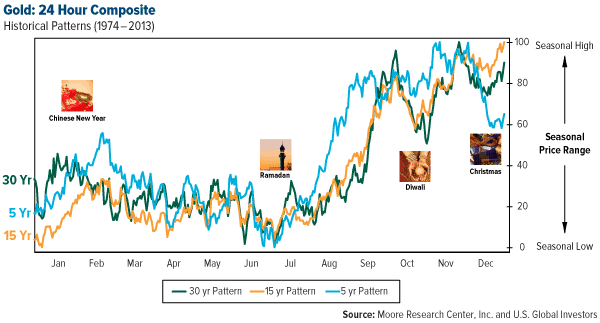
According to BofA Merrill Lynch, from 2001 to 2014, the yellow metal gained 14.9 percent on average between mid-summer and mid-autumn.
Prices in New Zealand dollars have already been trending steadily higher all this year. So a post June/July rally could put them on a steadier rise.
Of course history doesn’t necessarily repeat but if it rhymes it could make this a good time to buy.
Free delivery anywhere in New Zealand and Australia
We’ve still got free delivery on boxes of 500 x 1oz Canadian Silver Maples delivered to your door via UPS, fully insured.
Todays price is $14,050 and delivery is now about 7-10 business days.
This Weeks Articles:
|
|||||||||||||||||||||||||
|
|||||||||||||||||||||||||
|
|||||||||||||||||||||||||
|