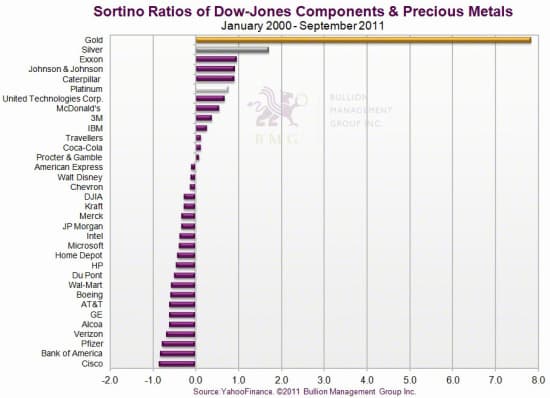
If you worry about the day to day fluctuations in gold then the following set of charts should help ease your mind a great deal. They show the corrections gold has had over the last decade plotted on a daily, monthly, quarterly and annual basis. They’ll help really add some perspective. The charts actually show how little volatility gold has in the slightly longer term. i.e. it’s the part of any portfolio that is the least likely to be negative! These also reminded us of a chart we saw last month care of BMG showing the Sortino Ratios of gold and silver versus S&P blue chip stocks…
Unlike a simplistic volatility measure that ignores returns, the Sortino Ratio measures the risk-adjusted return of an investment asset, portfolio or strategy. It uses only downside volatility, unlike the more popular Sharpe Ratio that uses both upside and downside volatility. The thinking is that although we don’t really like volatility in investments, if the volatility is only to the upside, it would mean the investment is rising, which is good. One common myth is that “gold is volatile.” This chart shows the Sortino Ratio of the 30 Dow Jones Industrial Average components, the Dow Jones index and precious metals since 2000. Gold is the clear winner in this analysis. It has been rising steadily for a decade with little in the way of downside volatility. Over the past ten years gold has outperformed all of the Dow components, and with less risk. The Sortino Ratio shows that gold, over the past decade, has had a much better risk-adjusted return than blue-chip stocks in the Dow 30.
By Jeff Clark, BIG GOLD
I’ve told more than one concerned investor that when the gold price falls, they should “come back in three months” and see if they’re still worried. The idea is that the daily and monthly gyrations are nothing to fret over, that the price will recover and, in time, fetch new highs.
That advice has worked every time gold underwent any significant correction (except in late 2008, when one had to take a longer view than three months). Here’s proof.
I’ve traded emails regularly with Brent Johnson ever since meeting him at an investor event I spoke at a couple years ago. He’s the managing director of Baker Avenue Asset Management, a wealth management firm with over $700 million in assets. He forwarded some charts he’d prepared for his clients that put gold’s September decline into perspective; it’s a good visualization of my standing advice to worriers.
The following charts document corrections in the gold price of 8% or more – first measured with daily prices, then monthly, quarterly, and finally annually. See if this doesn’t put things into perspective.
(Click on image to enlarge)
(Click on image to enlarge)
(Click on image to enlarge)
(Click on image to enlarge)
While the gold price has had plenty of big corrections since late 2001, they’re not so concerning when viewed beyond a day-to-day basis. In fact, if one resists checking the gold price except once a quarter, one might wonder what all the fuss with price declines is about.
You’ll also notice that the September decline, when measured monthly, was our second biggest in the current bull market (and third when calculated daily). This suggests to me that unless we have another 2008-style meltdown in all markets, the low for this correction is in.
That’s not to say the price couldn’t fall from current levels, of course, nor that the market couldn’t get more volatile. It’s simply a reminder that when viewed on any long-term basis, corrections are nothing but one step down before the next two steps up. It tells us to keep the big picture in mind.
It also implies that pullbacks represent buying opportunities. It demonstrates that one could buy any 8% drop with a high degree of confidence. Keep that in mind the next time gold pulls back.
Until the fundamental factors driving gold shift dramatically – something that would require most of them to completely reverse direction – I suggest deleting any worries about price fluctuations from your psyche.
And if you’re still a tad uneasy about today’s gold price, well, let’s talk next February.
[The current issue of BIG GOLD lists the top stocks to buy in our portfolio, ones we’re convinced are destined for much higher stock prices before this bull market is over. Get their names, along with our new Bullion Buyers Kit, with a risk-free trial here.]


Pingback: Schizophrenic markets and why the US may be the last to fall | Gold Prices | Gold Investing Guide