Last October we wondered whether we had seen a trend change with the US Dollar starting to weaken. Or rather for us here in New Zealand, the Kiwi Dollar starting to strengthen.
We thought it was time to check back in on this theory as it indeed seems to have been the case.
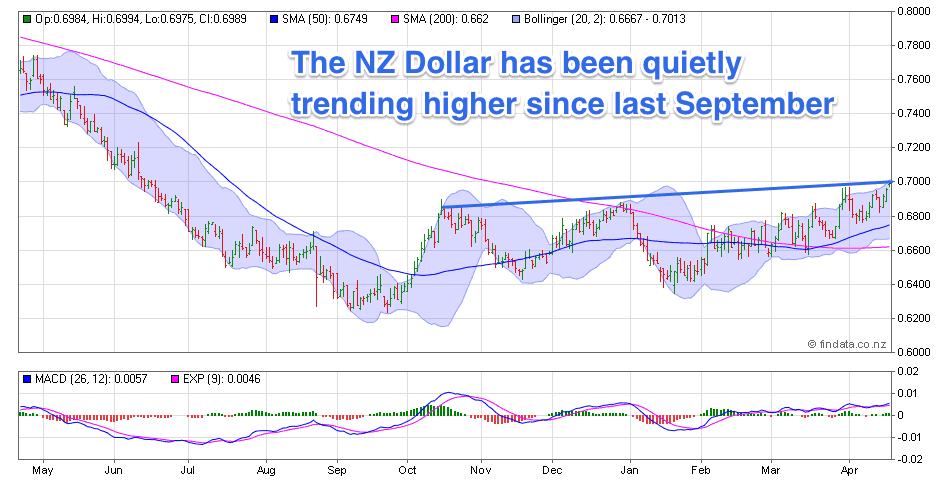
Below is a chart of the NZ Dollar for the past year. We can see the Kiwi Dollar has been quietly trending higher since bottoming out last September. It’s now just below 70 cents and is touching on the upper Bollinger Band (the blue shaded area). The Bollinger Bands are simply an indicator of likely upper and lower boundaries. So it may struggle to get much higher right now.
However it does seem safe to say the trend is up. Albeit at a slow pace.
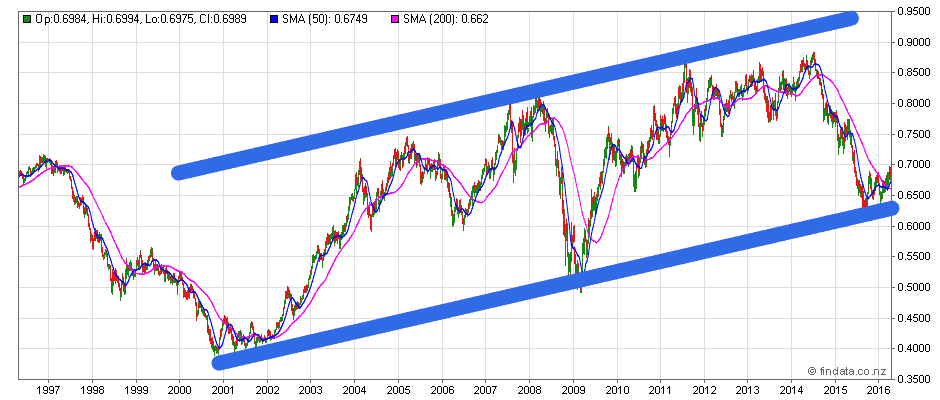
We have a long term 20 year chart below too, which adds weight to the idea that the Kiwi may have bottomed out and be in an uptrend now.
So What Does a Stronger NZ Dollar Mean For Gold and Silver Prices in NZ?
The most obvious thought might be that if the NZ Dollar is now in a rising trend that gold and silver in NZ Dollars will therefore be trending down.
However this has not been the case to date in 2016.
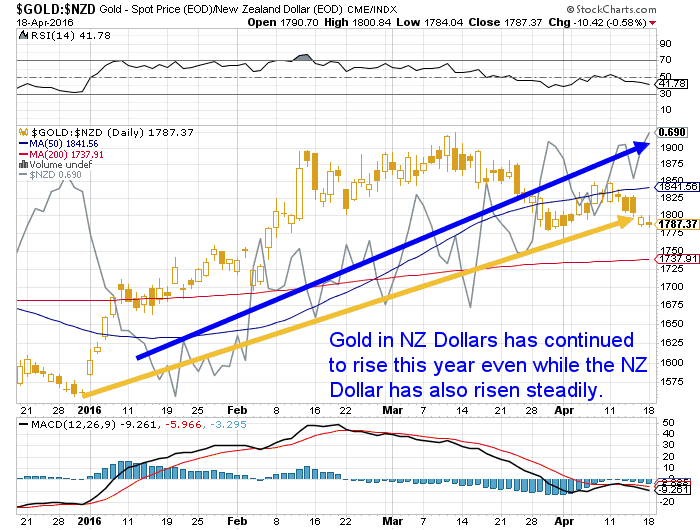
Below is a chart – a slightly messy one we’ll admit – of Gold in NZ Dollars, with the NZ Dollar also overlaid into it.
The NZD gold price is shown by the gold “candlesticks”. While the NZ Dollar is the solid grey line. We’ve added an arrow in blue to indicate the general trend for the NZ Dollar and one in gold for the trend in Gold in NZ Dollars so far this year.
This clearly shows that while the NZ Dollar has been trending up so too has gold priced in NZ Dollars.
How About Silver?
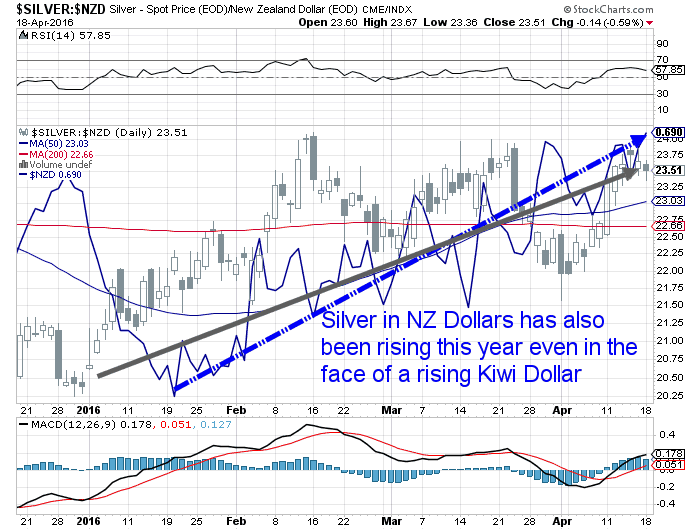
It’s much the same in play with Silver. Silver in NZ Dollars (see the grey candlesticks and the solid black upwards trending arrow) has also been rising even in the face of a strengthening NZ Dollar (indicated by the solid blue line and dashed blue up trending arrow).
Another factor is that for both gold and silver in NZ Dollars, the 50 day moving average (MA) (the thin blue line) is back above the 200 day MA (thin red line). So this is generally taken as an indicator of a market in an uptrend.
If the precious metals bull market has indeed returned, which we believe it has, then we favour this current trend continuing.
Or put another way, the US Dollar has been falling faster than the NZ Dollar against gold (and silver) this year. But the point is that against gold (and silver) they are both losing value.
So while the Kiwi dollar may end the year higher than it began it, we also think that NZ dollar gold and silver prices will finish the year higher too. Are you on board if they do?
To better understand what technical analysis is, and help with timing when to buy gold or silver and check out this article: Gold and Silver Technical Analysis: The Ultimate Beginners Guide
To learn more about when to buy gold and silver see this article: When to Buy Gold or Silver: The Ultimate Guide

