Just over 3 years ago we wrote an article asking the question When will you know it’s time to sell gold?
In this article we wrote about 7 factors that would give an indication as to when it was time to swap gold for another asset class. Some were objective and measurable and some more subjective. (Check it out if you haven’t as it has been a popular article over the years).
We’ve been meaning to do bit of an update to this piece for a while but then we noticed in a recent video Mike Maloney actually covered off a number of the measurable objective indicators himself. The video really outlines the big picture for gold and silver and might be useful for anyone worrying about what’s up with gold and silver at the moment.
So we thought we’d post the video along with a summary of its content in case you’d prefer to read than watch. We’ve also added a couple of updated charts similar to those Mike uses in his presentation. So on to the big picture precious metals update, the video is right at the end if you’d prefer to watch that…
Maloney begins by commenting how stock markets are going up but it only took 2.2 trillion dollars from the US federal reserve to get them there! As can be seen in the below chart.
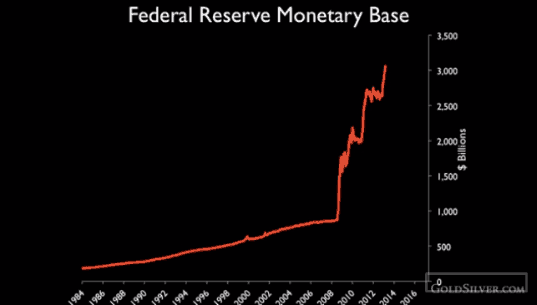
However 1.7 trillion of this 2.2 trillion is just sitting on banks balance sheets so this hasn’t leaked out into circulation yet. But the banks get to use this as leverage in the stock market. So this increases the “gambling” in the stock market and helps push prices higher.
Gold in today’s dollars
That is inflation adjusted using government CPI results in a 1980 high for the price of gold of $2500.
However using the “old” CPI stats via ShadowStats.com results in an inflatiuon adjusted 1980 high of $9946.88. See the chart below to see how far we still really are from the 1980 high.
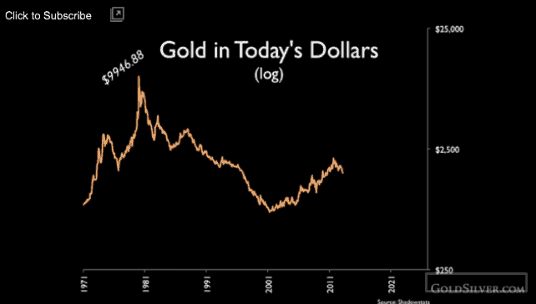
The truth probably lies somewhere in the middle of these 2 measures.
But for gold to be in a bubble, and if the fundamentals were the same as 1980, the price today would have to be somewhere between these 2 numbers of $2500 and $9946. However Maloney believes the fundamentals are not the same as 1980, so the price of gold will likely exceed the old high.
Dow/Gold ratio over the past 100 years
1971 was the first time in human history when gold and silver were no nations money. Over the next decade when the public bid up the gold price until it reached a bubble in 1980.
Then over the next 20 years gold became the most hated asset on the planet, as in 1999 it took the most amount of gold to buy the Dow ever. Gold was just 1/45 of the value of the Dow Jones industrial average (DJIA)!
But this has changed over the past decade with it now taking only 11 ounces of gold to buy the Dow.
Mike gives a great explanation of the important difference between log charts and linear charts (amount of change versus the rate of change) and then uses this to outline why even though the Dow/Gold ratio is down a long way from it’s 2000 high there is still a lot of upside left.
See the Log chart below of the Dow/Gold ratio which clearly shows the amount of upside left in gold (actually the chart makes it look more like downside as when gold rises versus the Dow the plotted line falls. In the video Maloney reverses the chart so that it is the Gold Dow ratio and it is currently rising rather than falling versus the Dow).

Maloney expects the day when golds price is double the points on the Dow – meaning it only takes half an ounce of gold to buy the stocks in the DJIA. The above chart from Sharelynx.com shows a similar level may be reached of just under 1 ounce to buy the Dow.
Why it’s important to note that the gold bull market began in 1999 not in 2001
Most analysts in gold plot the gold bull market starting in 2001 instead of 1999. It should be 1999 as this was the lowest price point in gold. This is important in terms of where the rising trend lines are drawn in from. His chart shows we are still within the confines of this rising channel.
Mike points out that so far in this bull market, the greatest gains began after the consolidations end (hint: we are in consolidation phase right now!)
He thinks there are some spectacular moves coming, if not this year then he thinks it will be next year.
Gold/Silver Ratio
He next looks at the Gold/silver ratio or he prefers to see the Silver/Gold Ratio so the chart is rising when silver goes up against gold.
The average of silver in the ground that’s mineable is 12-15 times more than gold, hence the long term price of silver versus gold is around 15 to 1. But that has been out of whack now for a century, following the demonetisation of silver in the 1800’s.
Now since World War 2 we have used up the above ground stockpiles of silver.
There is normally 5-10 years of above ground supply ( that is if you stopped mining at a given moment that is how long it would take to run out of silver). How we got down to only 3 months of above ground supply in recent times. We are coming off this low now.
This is one of the most bullish factors for silver. Once stock piles start rising it means investors are bidding silver away from industry and paying exchanges to store it. So stockpiles start rising. The last time this happened in the 70’s silver went from $4 to $50.
Converting the 1980 high for silver into todays dollar using Shadows stats CPI, it would be $590.96 per ounce. Even using current CPI statistics that the US government uses, silver would need to be $150 per ounce to reach the 1980 high.
So Mike believes silver will rise significantly from here.
In fact he believes there will be a super spike in silver and the Silver Dow Ratio will increase significantly.
Gold silver ratio may reach 10 to 1. So you may get 6 times the leverage buying silver from current ratio which is around 60 to 1.
Technical Analysis of Silver
Looking at some technical analysis for silver Mike outlines how the flash crash that occurred on Monday 20th April 2013, where silver dropped down into the US$20 area in Australian and Asian trade and then rose again, may be good news.
Why?
Because back in 2010 silver blew through US$21 (previously resistance without stopping and didn’t go through any trading range around that area. So it needed to go back down and “fill that gap” around US$21.
So the low for silver “might” be in.
Although we could yet see $19 silver still but that is not that far below where we are now.
So overall when looking at the fundamentals, gold and silver have to rise to cover a certain percentage of the currency supply, to make up for inflation, and to get back into balance with other asset classes like real estate and stocks.
He comments that people always chase “yesterdays news”. And so all the liquidity that has been created by the central bankers like Bernanke is going into the previous asset classes that people were chasing because those are the familiar asset classes. Very few people own gold or silver as an asset class, but there will come a day when precious metals will become a fairly large asset class – i.e. the price per ounce will go a lot higher.
So a bull market isn’t over until the fundamentals say it’s over – not when a technical analyst says it is!
Full video below:
Pingback: RBNZ Jawboning But May Follow Through | Gold Prices | Gold Investing Guide