We just read this interesting article from Stansberry & Associates Jeff Clark (not to be confused with Casey Research’s Jeff Clark whose articles we also sometimes feature). headlined:
Gold Soared 80% the Last Time This Indicator Flashed “Buy”
It got us thinking about how this same gold indicator might look for gold in NZ Dollars. But first we better Jeff Clark run through his explanation before we give our gold in NZ Dollar version of it afterwards:
“[W]e’re likely about to get a “buy” signal from one long-term gold-buying indicator. The last time this indicator flashed “buy,” gold soared 80% in a little more than two years…
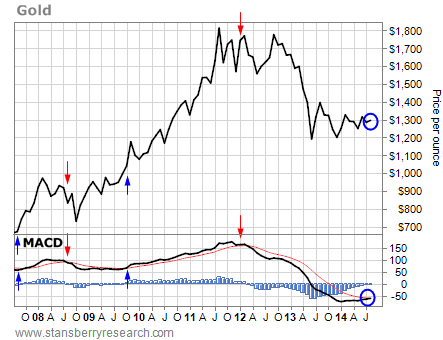
Take a look at this long-term monthly chart of gold…
The bottom of the chart shows the Moving Average Convergence Divergence (MACD) momentum indicator. On a short-term basis, the MACD shows overbought and oversold conditions. On a long-term basis, the MACD can be used as a timing indicator.
Without getting too complicated, when the shorter-term black trend line crosses above the longer-term red trend line, we have a “buy” signal. When the black line crosses below the red line, we have a “sell” signal.
The arrows on the chart show you how previous buy and sell signals have worked out in the past.
Keep in mind, this is a MONTHLY chart. So these are long-term buy and sell signals. They point out trends that are likely to last a year or more.
For example, the last buy signal for gold was back in October 2009. The signal lasted for more than two years, and gold rallied from about $1,000 per ounce to more than $1,800 – around an 80% gain – just before the MACD indicator generated a sell signal.
That sell signal has now been in place for 2.5 years. Gold has fallen from $1,800 per ounce to its current price of around $1,300.
But look at the setup on the MACD indicator. The black line is curling up and is on the verge of crossing over the red line. If this happens, it will generate a long-term buy signal for gold – the first long-term buy signal since 2009.
Since this is a monthly chart, all that matters is how the indicator looks at the end of the month. But based on how it looks right now, gold is about to soar.”
Well, bold words from Mr Clark saying “gold is about to soar.” It certainly doesn’t feel like it currently. Gold remains firmly in limboland with it having not really gone anywhere these past few months. As we’ve said in recent newsletters we’d have to see it move above the highs in March before we got too excited. But Jeff Clark seems to think we are getting close to having a crack at them now.
So how about NZ Dollar Gold?
What’s the MACD indicator doing on a monthly chart of Gold in NZ Dollars?
We’ve put together our own version to see how it compares to the USD gold chart in Jeff Clark’s piece. In short, similar but also different to US Dollar gold.
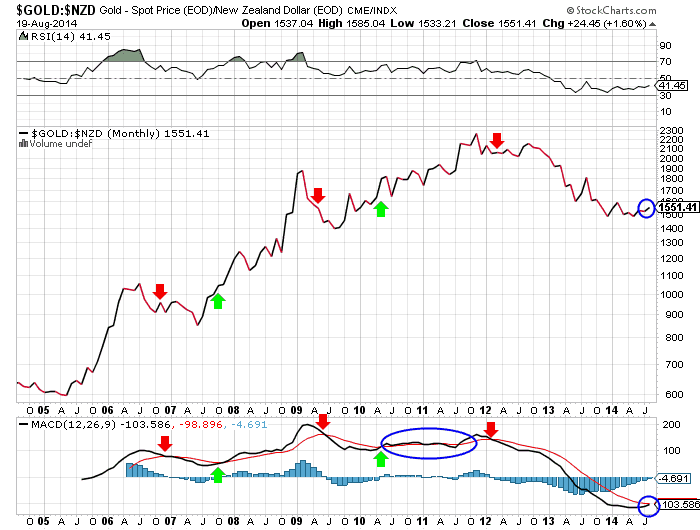
We can look back over the past 10 years and clearly see a number of situations where the shorter-term black trend line crosses above or below the longer-term red trend line. We’ve marked these on the chart with arrows.
Red arrows for a sell signal with the shorter term black trend line crossing below the longer-term red trend line.
Green arrows for a buy signal with the shorter term black trend line crossing above the longer-term red trend line.
These signals matched up nicely with falling or rising NZD gold prices soon after (see the corresponding arrows in the top part of the chart). Apart from the period from mid 2010 to mid 2011 where we had multiple buy and sell signals (see the blue oval). So like any technical indicator this one is not infallible.
But apart from this period, the crossing over of the shorter term and longer term trend lines have proven quite useful to follow as a timing indicator.
Interestingly these trend changes weren’t in line with those that occurred in US Dollar gold.
However the current change in trend that looks to be occurring, with the shorter term black trend line crossing above the longer-term red trend line (blue circle), is taking place in both USD and NZD gold.
So if Jeff Clark proves correct this will also end up being a very opportune time to be buying gold for NZ buyers too. Also coupled with the fact that the MACD is the most oversold it has been in this entire precious metals bull market. Heading up slowly from being down below -100 for the past 9 months.
Just head on over to our order page if you like the sound of that and you’d like a quote.
For more on this topic check out this article:
Gold and Silver Technical Analysis: The Ultimate Beginners Guide
To learn more about when to buy gold and silver see this article: When to Buy Gold or Silver: The Ultimate Guide
Pingback: NZ Dollar Breaks Below Key Support - Gold Prices | Gold Investing Guide
Pingback: “Golden cross” for NZD gold and silver has occurred - Gold Prices | Gold Investing Guide
Pingback: Beginners guide to technical analysis - Gold Prices | Gold Investing Guide