
After rising sharply from March to August last year during the COVID19 panic, silver then fell sharply throughout late 2020. After a jump higher in February due to the much publicised silver short squeeze attempt, silver has been down since then. As a result, we now have what looks like an excellent silver buy zone. Here’s a look at a few silver charts showing why this might be…
Table of Contents
Estimated reading time: 9 minutes
The Big Picture NZD Silver: 4 Major Trends Since 2005
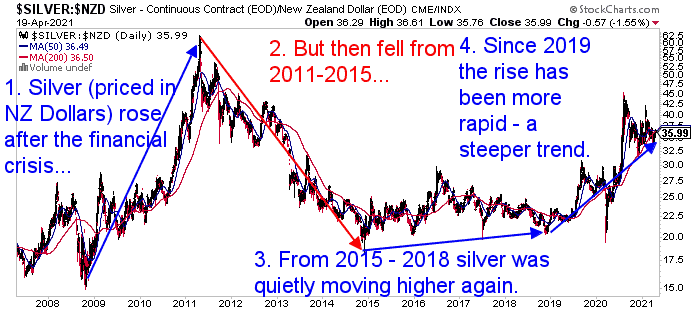
Looking back to 2008, silver has seen 4 major trends.
- In the lead up to, and then also just following the financial crisis, silver in New Zealand dollars rose sharply.
- But then silver fell from 2011 through to 2015.
- Since 2015 silver had been quietly moving higher without many people noticing.
- Then in 2019 the uptrend got steeper. Following the sharp drop in March 2020 caused by the COVID panic, silver rose sharply through to August reaching NZ$45. But pulled back sharply since then to as low as NZ$31. However silver remains in the uptrend from 2019.
Zoom In: Daily Chart From 2015 to 2018
Back in November 2018 we posted the below daily chart of silver in NZ Dollars.
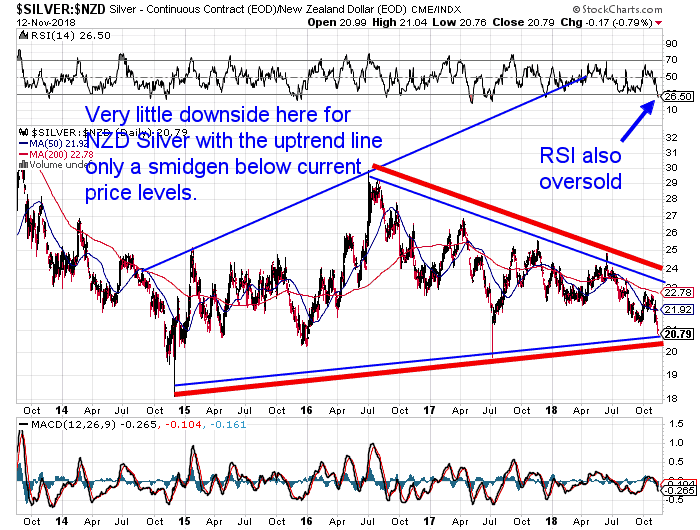
We commented:
Silver has dipped quite sharply in the past couple of weeks. It is now at a new low for 2018 just above $20.
NZD silver is also pretty much back down to the rising trend line dating back to the late 2014 lows.
On top of this, the RSI overbought/oversold indicator is now well into oversold region below 30. If you look back at previous times the RSI was below 30, you’ll notice this is where we often see lows in price reached.
See this for more on understanding technical analysis terms: Gold and Silver Technical Analysis: The Ultimate Beginners Guide >>
How Have Things Played Out Since late 2018?
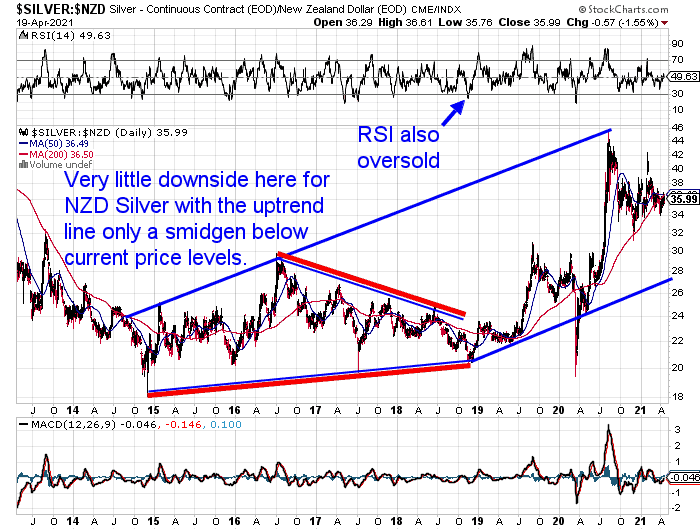
So what has happened with silver since late 2018?
Here’s the same chart with the last couple of years also included. November 2018 was indeed a very good time to be buying silver. As noted earlier, silver did of course spike briefly lower in March 2020. But it then rapidly rose through to the August 2020 high.
What About Right Now?
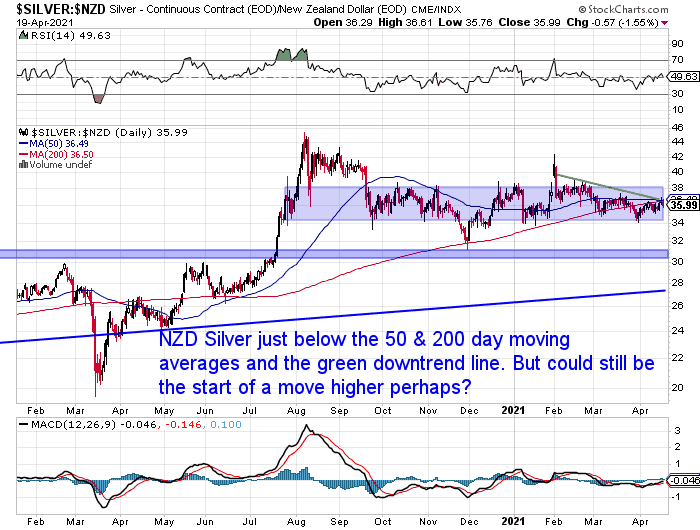
Silver in NZ dollars has been correcting since August 2020. It bounced up off the 200 day moving average (MA) (see the thin wiggly red line in the chart above) in November. It has done this multiple times since then. Recently silver did dip below the 200 day MA but is hovering right on it again now.
In technical analysis the price being above the 200 day MA is often considered the marker of a bull market or uptrend. So buying as the price hits or bounces off the 200 day MA is often a very good time to buy.
Silver has been behaving quite strongly since November. Actually outperforming gold from then. But this recent dip below the 200 day MA could prove to be a very good buying zone.
Just as it did in late 2018, the Relative Strength Index (RSI) touched oversold (30) in late November 2020. See the top of the above chart. If we look back we can see that historically other times the RSI has hit 30 have coincided with bottoms in the price.
The RSI dipped close to 30 again in late March. This also proved to be a good time to buy as the silver price rose following this. Currently the RSI is neutral. However other indicators are pointing to now being a good time to buy silver.
The shorter term chart below shows that silver has been in a downtrend since the sharp rise brought about by the attempted silver short squeeze in February. (See: Will The “Reddit Raiders” Cause Silver to Skyrocket?) However silver did not get below the support zone at $34. It has been quietly rising again since touching that level in March.
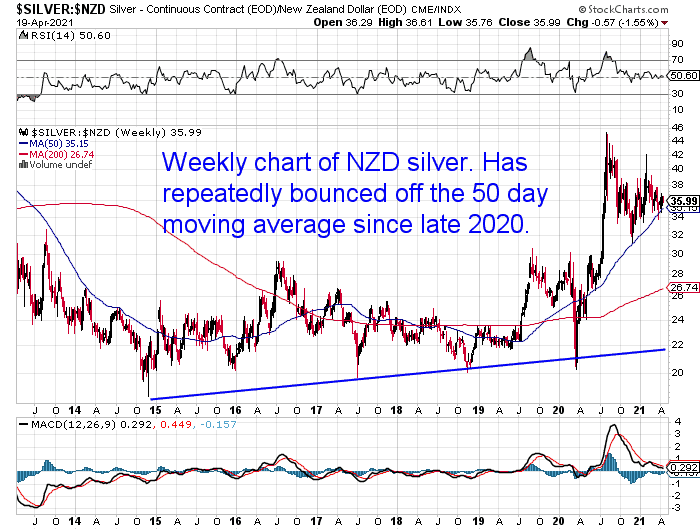
Weekly NZD Silver Chart
Next up, below we have a weekly price chart. This plots the closing price of silver every Friday and is helpful in smoothing out the day to day movements. We can see that on a weekly price basis, NZD silver has bounced up off the 50 day moving average multiple times since November. It has done so again this month. So silver may well have bottomed out there.
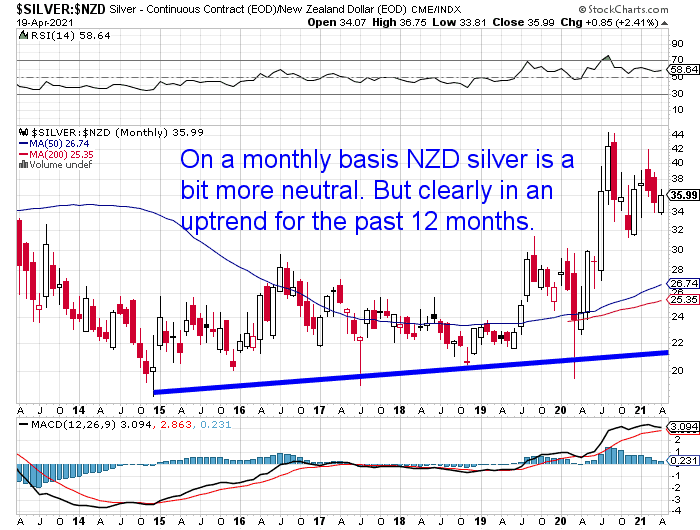
Monthly NZD Silver Chart
Finally we have a monthly NZD silver chart. This monthly chart plots the closing price of silver at the end of each month (April shows the month to date closing price). The monthly chart really smooths out the short term noise in the silver price. We can see that on a monthly basis NZD silver is a bit more bullish than on the daily or weekly chart. It shows the same rising trend since the plunge in March in 2020.
So you could make the argument that silver still has further to fall. However our thinking is that late 2018 (when we previously called an excellent buy zone for silver), was a change in trend for silver. From a very gentle subtle rise to a stronger rising market.
Therefore we think the odds remain very good that silver has recently bottomed out again in this longer term rising trend.
3 Contrarian Indicators That Silver Looks to be in an Excellent Buy Zone
We also have a few very significant contrarian indicators currently pointing to a bottom in silver in NZ Dollars…
1. Much Reduced Buying
At present, there is much lower buying interest in silver (and gold for that matter), compared to recent months. Compared to last year or the run on silver in February, there are markedly lower levels of buying this month.
Our experience has been that bottoms often happen when very few people are interested in buying. Probably because most people are at that time worried the price will fall further.
2. Website Visitor Numbers Down
Also our website visitors are down over the past month or so compared to what they have been for much of 2020. We commented on this in our weekly newsletter about a month ago. Since then visitor numbers have dropped off even further.
This is another indicator of lessening interest in precious metals. Again a good indicator that a bottom may have taken place.
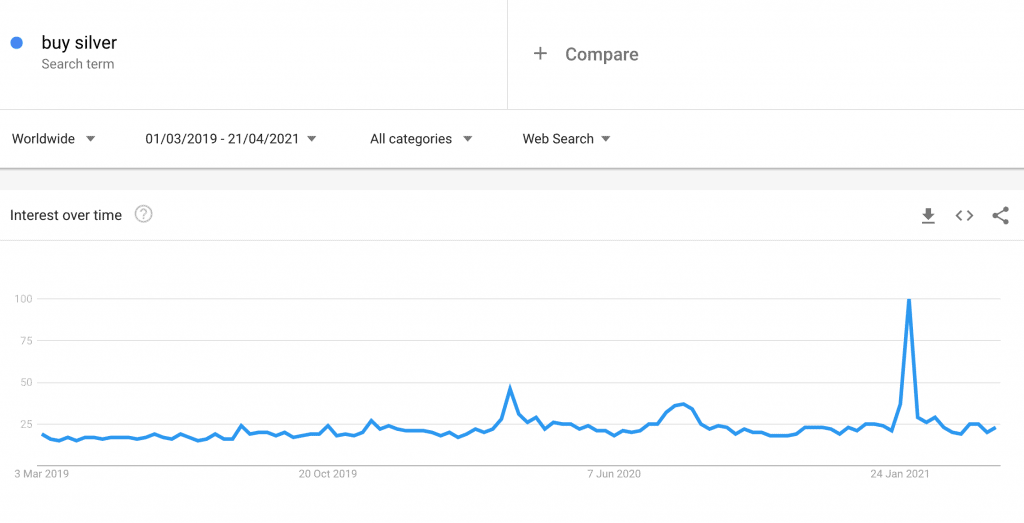
3. Google Trends for Buy Silver
Google Trends show the interest in particular searches over time. The chart below shows that the level of interest worldwide in the search phrase “buy silver” spiked in early February. This was due to the silver short squeeze publicity. However interest in “buy silver” is now back to similar levels as it was prior to COVID19.
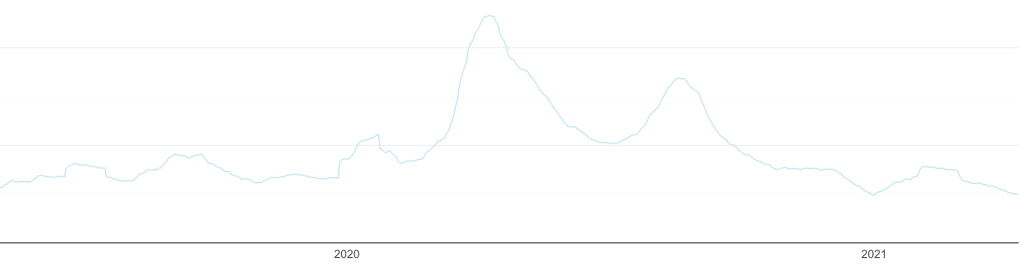
For comparison here are the search trends for “buy gold”. It too is back to levels not seen since before COVID19:
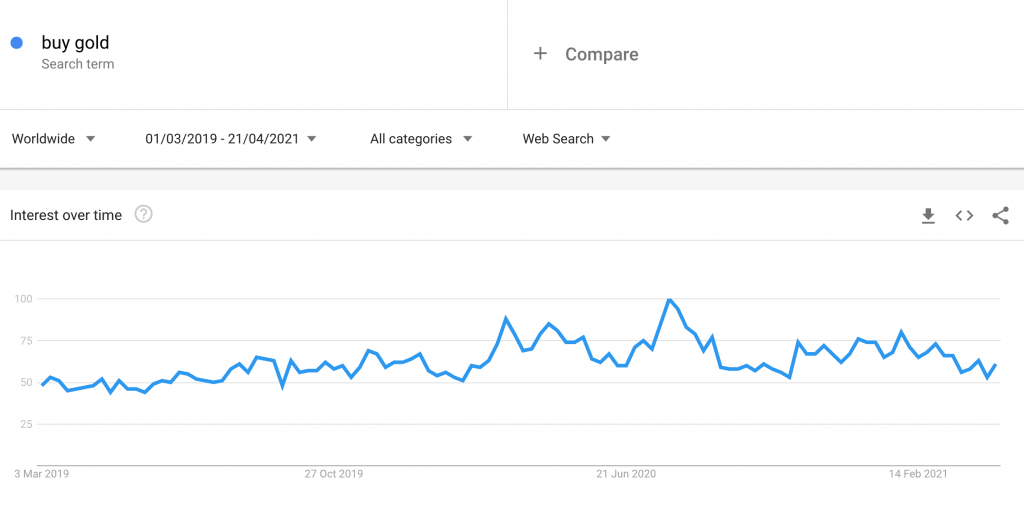
So the above charts seem to be indicating silver is in an excellent buy zone right now. But so are our 3 contrarian indicators.
A Weakening NZ Dollar May Also Give NZD Silver a Boost
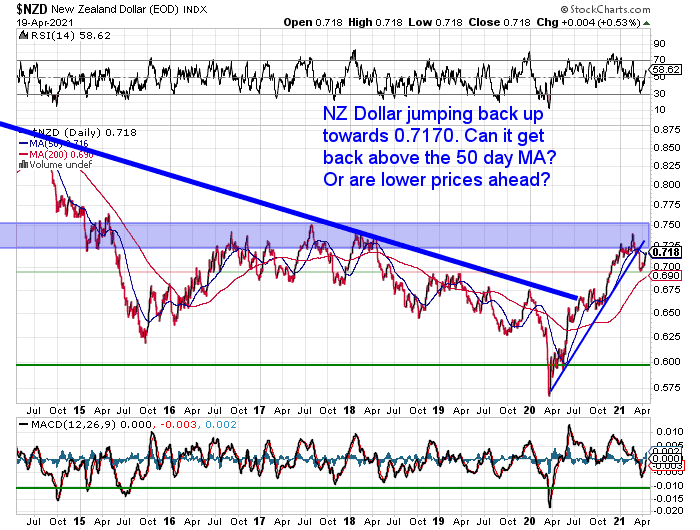
Also the New Zealand Dollar has some potential to give silver prices in New Zealand a boost. The Kiwi has risen sharply from March. After getting as low as 0.56 it is currently above 0.71. It did recently correct down from as high as 0.73. But is now back up right on the 50 day moving average at 0.718.
The Kiwi is evenly poised here. But if the NZ dollar did weaken down to say the 200 day MA at 0.69, that will give local silver prices a boost higher too.
No Guarantees
Of course the above is all just our best guess. there are no guarantees when it comes to silver!
But be careful about trying to time an exact bottom in silver. This can lead to paralysis by analysis. Trying to second guess whether the price will go lower from here. Thus, leaving you sitting on the sideline as the price moves higher.
If you’ve been looking to buy silver this is likely to be a pretty good area to get a foot hold. If in doubt consider taking an initial position, but keeping some funds in hand for another purchase of silver if the price fell further.
To learn more about when to buy gold or silver check out this article: When to Buy Gold or Silver: The Ultimate Guide
Editors Note: This post was originally published on 24 July 2018. Last updated 20 April 2021 to include latest charts.
Pingback: 3 Contrarian Indicators Show it’s a Great Time to Buy Silver - Gold Survival Guide
Pingback: Roubini: Is Stagflation Coming? - Gold Survival Guide