
Over the past couple of weeks we’ve been talking about how gold and silver have bottomed in December for the past few years (see: Cryptocurrencies the Opposite Phase to Silver?). Plus how in 6 of the last 7 years buying gold at the end of one year saw higher prices by the end of the following year (see: When to Buy Gold or Silver: The Ultimate Guide).
Here’s an in depth look at the gold and silver charts and why the current very “dark” sentiment is setting gold and silver up for a brighter New Year…
Are You Ready For The Next Rally?
Originally published at SprottMoney.com
Each of the last three years have begun with gold rallies of over 10%. The stage is set for another such move in 2018. Are you prepared?
Many folks have written about how the current selloff in gold and silver was predictable. Whether it was expected due to tax-loss selling, seasonality, CoT-washing or the expected FOMC rate hike, the majority of analysts were expecting price weakness in November and December and, this time, the majority was correct.
But if this current selloff was so easily predictable, then why can’t the coming rally to begin the year be just as foreseeable and certain?
Below is a weekly chart of Comex gold going back to this time in 2014. Note the bottoms found in December of each of the past three years and then be sure to note the January-February rallies in 2015, 2016 and 2017:
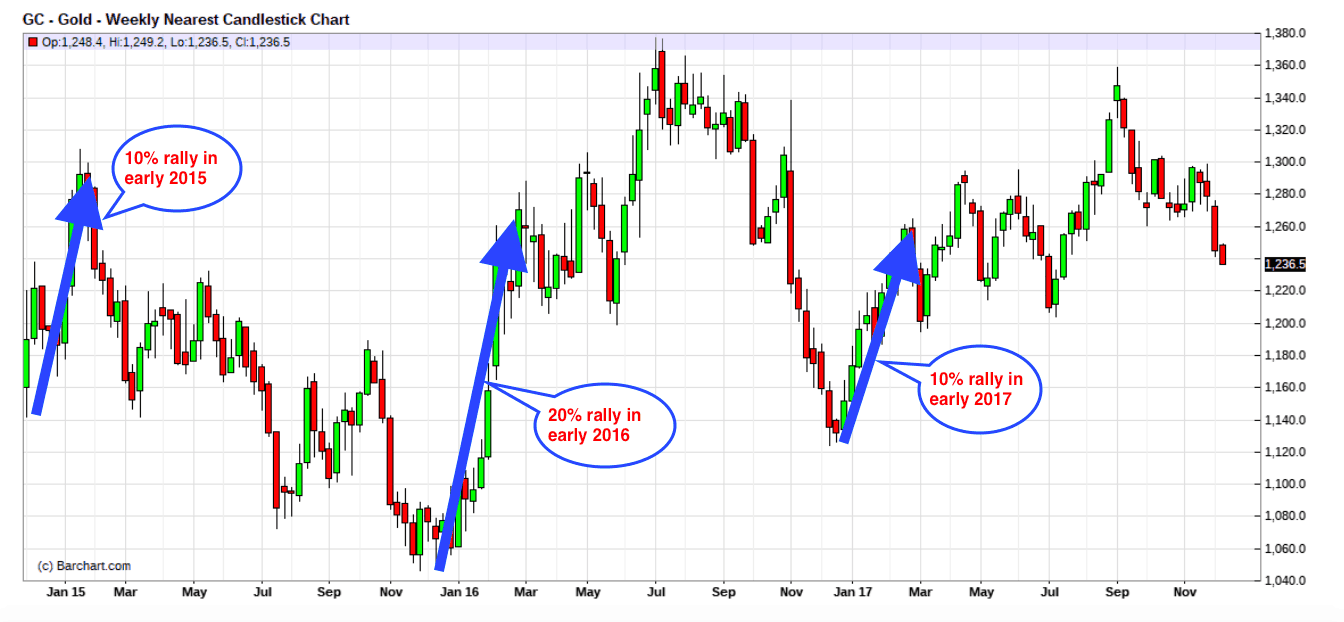
At TFMR we have an old adage that applies here: “When trading gold and silver, you must always be prepared to sell a little when things look rosiest and buy a little when things look the darkest”. I don’t think that anyone would argue that December 2017 feels like the darkest period in recent memory.
And this “darkness of sentiment” is reflected in the Relative Strength Indices for gold, silver and the shares. If you’re unfamiliar with this important technical indicator, you can read more about it here: https://www.fidelity.com/learning-center/trading-i…
Related: Gold and Silver Technical Analysis: The Ultimate Beginners Guide
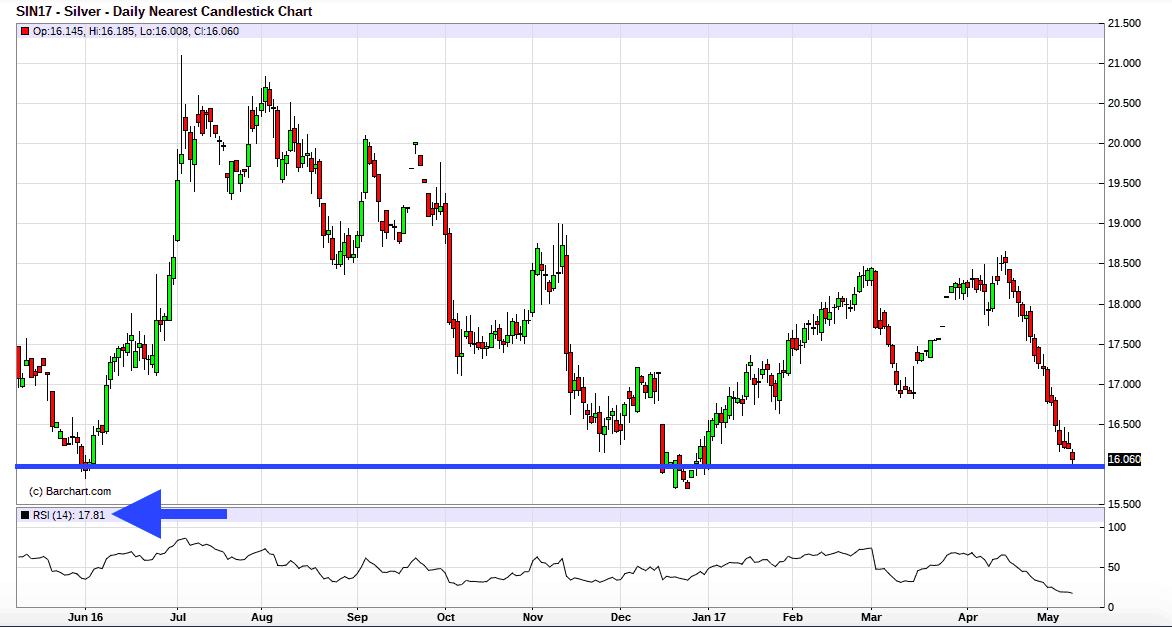
Generally speaking, rallies exhaust and price begins to turn lower as the RSI exceeds 70. In selloffs, short-term capitulation is usually seen when the RSI drops below 30. For example, after 17 consecutive down days for Comex silver last spring, price turned and rallied 10% in under four weeks from an RSI extreme low of 18.
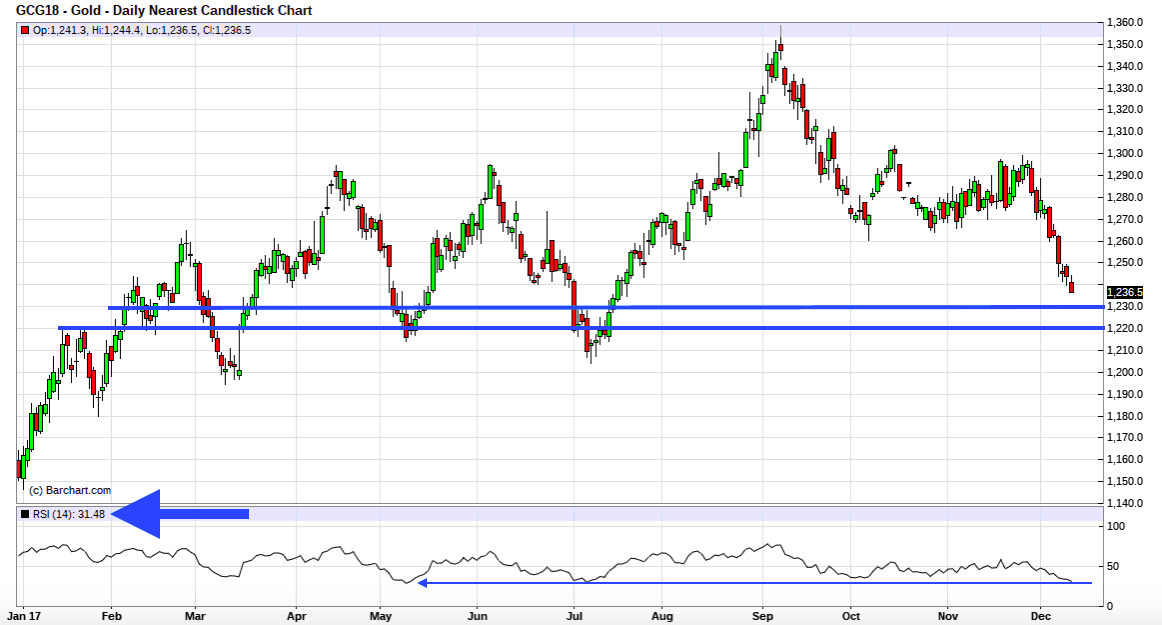
A look at the current charts only serves to reinforce the view that prices are oversold, near a bottom and ready for the usual late-December rebound and rally.
Comex Gold is near strong support of $1220 and its 200-week moving average near $1231. Also note, however, that its current RSI is 31 and near the previous 2017 lows seen at the turns in May and July.
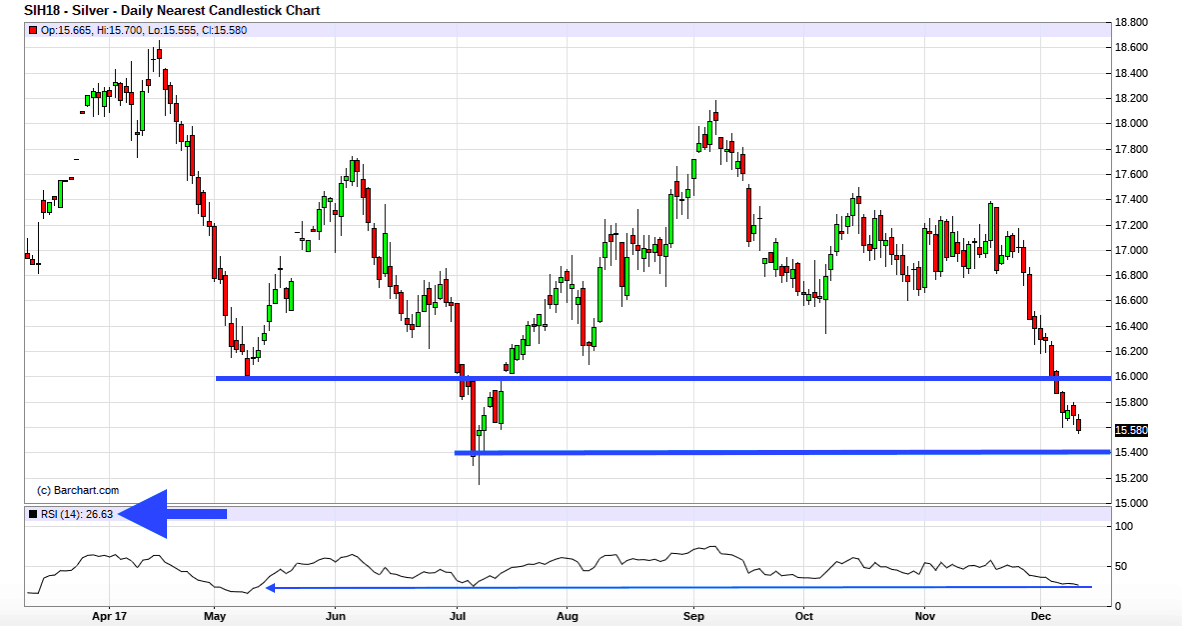
Comex silver is in its support zone of $15.50-$16.00 and its RSI is even lower at 26!
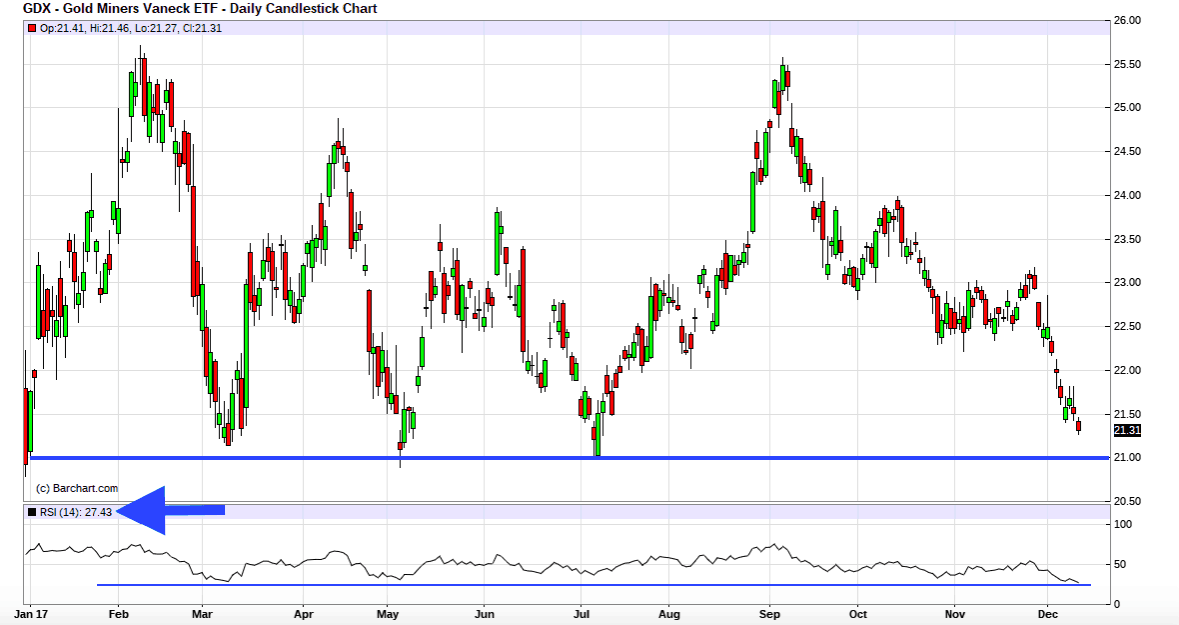
And the mining shares, as measured by the GDX, are clearly near a low, too. The price level of $21 has previously held as support on several occasions, tax loss selling in Canada will be finished by the end of next week and the RSI is at a 2017 low of 27.
Again, successful investing in the metals requires the ability to buy a little when things look darkest. To that point though, these buying opportunities don’t often clearly present themselves. The only question remaining for December of 2017 is…are you prepared to take advantage this time?
About the Author
Craig Hemke began his career in financial services in 1990 but retired in 2008 to focus on family and entrepreneurial opportunities. Since 2010, he has been the editor and publisher of the TF Metals Report found at TFMetalsReport.com, an online community for precious metal investors.