This Week:
- Gold Mining Shares vs Physical Gold Bullion – Which to Buy?
- Why You Should Ignore the USD Gold Price When Buying Gold in New Zealand
- Fed Holds Rates, Has Quantitative Tightening Been Paused?
- Central Banks Buy More Gold in 2018 Than Any Year Since 1967
Prices and Charts
Gold Nears New Year High
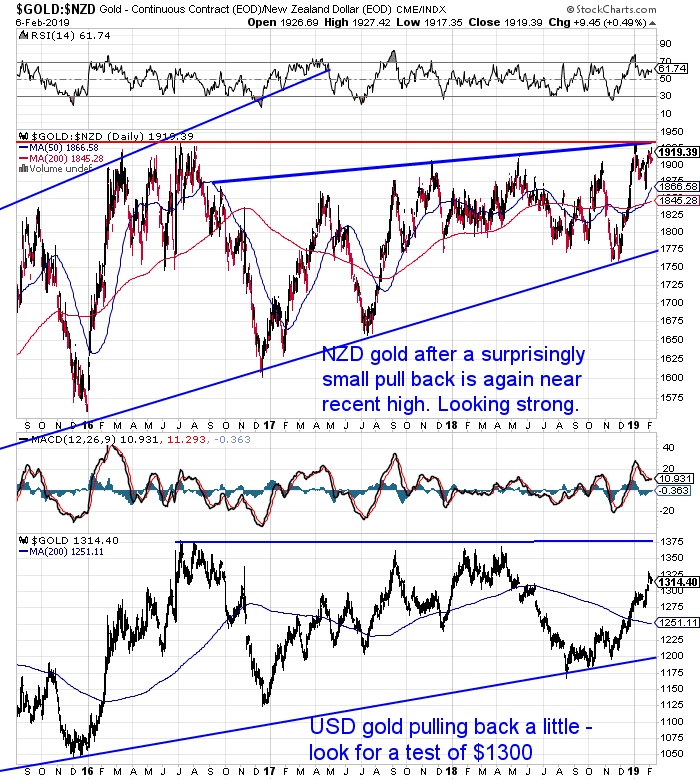
Gold in NZ Dollars moved higher today care of a weaker Kiwi Dollar (more on that below). Gold is now back to the high reached at New Year. (Although this isn’t visible on the chart below as this dollar plunge happened after the closing price was added).
The pullback in gold has been surprisingly brief. After the strong run higher to end 2018, a deeper correction would have been expected. So this is looking promising for gold in the coming weeks. A break out may not be far away.
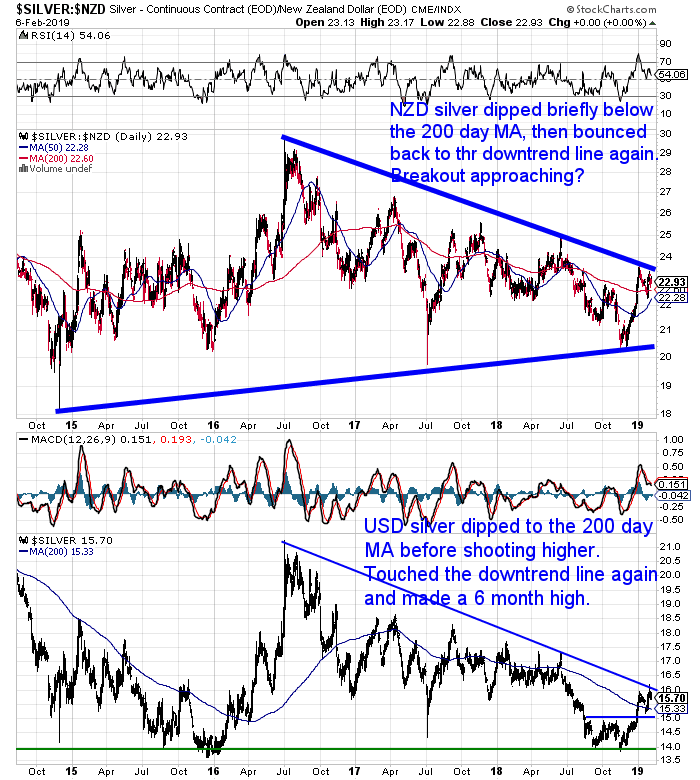
Meanwhile silver is actually down slightly on a week ago. But it too has touched on the overhead trend line yet again.
Silver will take its lead from gold. So if gold can break out decisively then silver should also follow. There is a lot of upside ahead for silver if a breakout occurs. Just to get back to the 2016 high would be a rise of 30%.
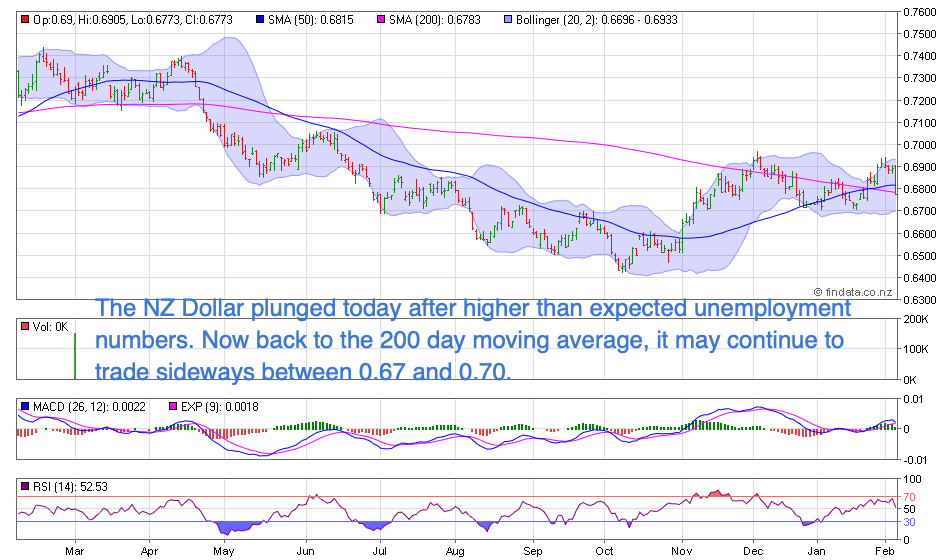
As noted already, the Kiwi dollar plunged this morning. It’s now sitting back on the 200 day moving average. The fall came after unemployment numbers came in at a higher-than-expected 4.3 percent in the fourth quarter.
While employment growth rate in the quarter was 0.1 percent, down from 1.1 percent in the previous quarter. Economists had predicted an employment growth of 0.3 percent.
News Hub reported:
“The figures by Statistics NZ “add to signs that the economic momentum the Government inherited has ended, and the economy is now slowing”, National’s Finance spokesperson Amy Adams said.
“The unemployment rate is still relatively low; however we have now slipped from having the 9th to the 14th lowest unemployment rate in the OECD,” she said.
“At the same time, jobs growth has stalled and the underutilisation rate has increased.”
…The New Zealand dollar fell sharply to $0.6782 from $0.6825 immediately after the data was announced, and settled around a two-week low of $0.6773.”
Source.
So this news will likely have currency traders thinking the odds of an interest rate cut have increased. Therefore they are selling the NZ Dollar and buying the US Dollar.
NZ Dollar Gold Price vs US Dollar Gold Price
If this talk of currencies has you at all confused then check out this post.
It’s a common area for new investors to get bogged down in. Should you be following the US dollar gold price or the NZ dollar gold price?
Read on to see.
Need Help Understanding the Charts?
Check out this post if any of the terms we use when discussing the gold, silver and NZ Dollar charts are unknown to you:
Continues below
—– OFFER FROM OUR SISTER COMPANY: Emergency Food NZ —–
Preparation also means having basic supplies on hand.
Are you prepared for when the shelves are bare?
For just $190 you can have 4 weeks emergency food supply.
Free Shipping NZ Wide.

Gold Mining Shares vs Physical Gold Bullion – Which to Buy?
As noted above gold in NZ dollars is looking quite strong and possibly ready to break out to new multi year highs.
If this break out happens there is a lot of upside ahead for gold. See where these levels are and how far off a potential breakout may be.
Also check out what may be in store for silver.

Fed Holds Rates, Has Quantitative Tightening Been Paused?
Last week the US central bank held interest rates. No surprise there. But what was surprising was their updated “balance sheet policy” after ‘extensive deliberations’:
- The Committee intends to continue to implement monetary policy in a regime in which an ample supply of reserves ensures that control over the level of the federal funds rate and other short-term interest rates is exercised primarily through the setting of the Federal Reserve’s administered rates, and in which active management of the supply of reserves is not required.
- The Committee continues to view changes in the target range for the federal funds rate as its primary means of adjusting the stance of monetary policy. The Committee is prepared to adjust any of the details for completing balance sheet normalization in light of economic and financial developments. Moreover, the Committee would be prepared to use its full range of tools, including altering the size and composition of its balance sheet, if future economic conditions were to warrant a more accommodative monetary policy than can be achieved solely by reducing the federal funds rate.
Source: Federal Reserve
On top of this the latest data shows the Fed balance sheet only shrank by $28 billion during January. This was only just over half of the $50 billion a month target.
To learn more about the Fed Balance Sheet reduction or QT, see: Federal Reserve Balance Sheet Reduction: What Impact Did it Have in 2018? What about 2019?
Ed Bugos from TDV noted this week:
“For now, [the Fed] is signaling that it will pause its balance sheet reduction and its rate tightening campaign.
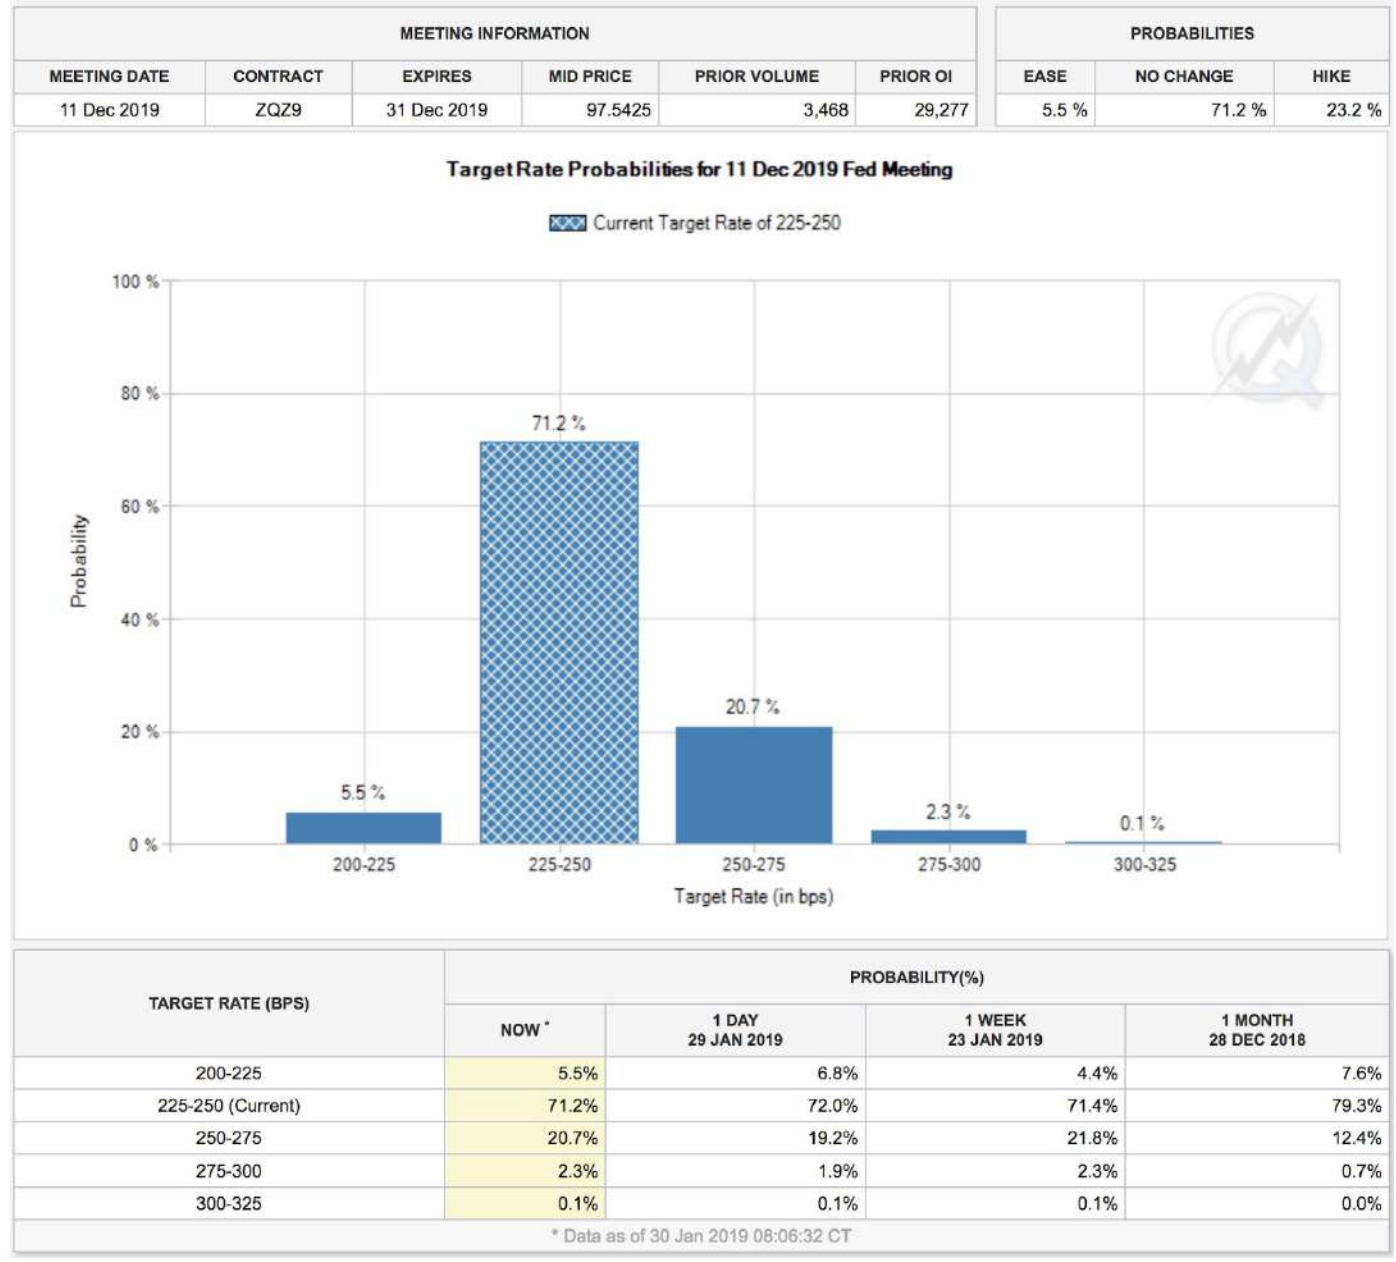
Rate Hike Probabilities Suggest QT is Over
In its last statement the Fed said,
“In light of global economic and financial developments and muted inflation pressures, the FOMC will be patient as it determines what future adjustments to the target range for the federal funds rate may be appropriate to support these outcomes.”
The graph above is a screenshot from the CME group’s website imputing the latest probabilities for hikes in the Fed funds rate between now and the end of 2019 -based on the pricing of interest rate futures.
Here’s what it tells me. The market assigns a 71.2% probability for a pause in the rate hike campaign this year with a 5.5% chance of a rate cut. The market is imputing only a 20.7% chance for one rate hike, and less than a 3% chance of anything more this year. In other words, the Fed has finished tightening.
In fact, the odds of a rate cut exceed the odds of anything more than one more hike.”
The Fed announcement, January’s balance sheet data, and the above rate probabilities are perhaps evidence that Fed head Powell is caving in to the inflationists right before our eyes. It could be why gold, silver, and the miners rose so much in January.
Your Questions Wanted
Remember, if you’ve got a specific question, be sure to send it in to be in the running for a 1oz silver coin.
Central Banks Buy More Gold in 2018 Than Any Year Since 1967
The latest World Gold Council Gold Demand Trends for full year and Q4 2018 show that:
“Central banks added 651.5t to official gold reserves in 2018, the second highest yearly total on record.
Net purchases jumped to their highest since the end of US dollar convertibility into gold in 1971, as a greater pool of central banks turned to gold as a diversifier.”
Interestingly (and perhaps not coincidentally?) 1967 was the beginning of the breakdown of the world monetary system. A few months later, in March of 1968, the London GoldPool collapsed. Central banks would no longer try to keep the price of gold down. Nixon eventually ended dollar convertibility to gold in 1971.
The stage was being set for an explosion in the price of gold in the 1970’s.
Perhaps this central bank buying in 2018 is indicative of another breakdown in the world monetary system? And of another explosion in the price of gold to come?
Be sure to have your financial insurance in place before it happens. We have plenty of gold and silver deals on offer today while stocks last.
- Email: orders@goldsurvivalguide.co.nz
- Phone: 0800 888 GOLD ( 0800 888 465 ) (or +64 9 2813898)
- or Shop Online with indicative pricing
— Prepared for the unexpected? —
Never worry about safe drinking water for you or your family again…

The Big Berkey Gravity Water Filter has been tried and tested in the harshest conditions. Time and again proven to be effective in providing safe drinking water all over the globe.
This filter will provide you and your family with over 22,700 litres of safe drinking water. It’s simple, lightweight, easy to use, and very cost effective.
Big Berkey Water Filter
New Stock Arriving Next Week – Learn More and Pre-order NOW….
—–
|