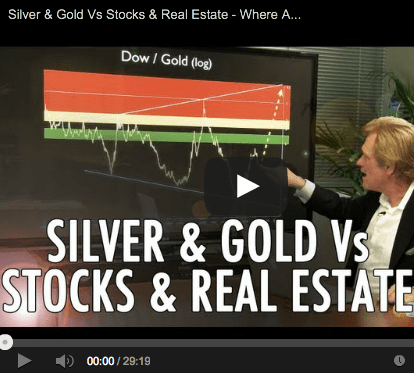
An information packed video here from Mike Maloney looking at indicators such as the gold to housing and silver to housing ratios, plus the Dow (US stock market) to gold ratio. He answers questions posed by readers such as whether with house prices currently rising and gold and silver falling have we seen the top in both metals and is housing a better bet now?
The video also covers:
- Why he will be waiting for gold to go to extremes against real estate that it hasn’t seen for more than a century
- How gold will buy you more real estate in the future than it did in 1980
- Why real estate needs to overshoot and get really undervalued to correct all the excess such as too many people in the real estate industry.
- Why he thinks we are in a short term move in real estate versus gold much like that seen in 1975.
- How the Dow Gold ratio will likely drop as low as a half an ounce of gold to buy the DOW
- The difference between a greed driven top (2011) versus a fear driven panic (1980)
After you’ve watched the video we’ve made a few notes below on some NZ comparisons…
How Do NZ Housing to Gold and Silver Ratios Compare?
To see some historical numbers for New Zealand Housing versus gold ratios see these previous articles of ours:
Could NZ House Values Drop by 80 Percent? (An initial look at NZ Housing to Gold Ratio)
NZ Housing to Gold Ratio Update
We need to update these charts sometime. But at a glance, with the median NZ house now priced at around $400,000 and gold in NZ dollars at around $1600 we have a current ratio of 250 ozs of gold to buy the median NZ house. Having gotten down to 200 ozs in 2011 the ratio is now back up to where it was in 2010 when we first wrote about it. So a similar bounce as Mike refers to in his current US housing numbers, and to that which occurred in the mid 70’s.
While the NZ housing to silver ratio is now back to around 15,400 ozs of silver to buy the median NZ house($400,000 house divided by $26/oz silver). Compare this to the end of 2010 where the NZ housing to silver ratio stood at just a hair under 9,500 ozs. So again we have seen a bounce much like the US numbers and the mid 70’s.
Here’s the link Mike refers to on the Hunt Brothers actually capping the price of gold in the 1970s.
Also here’s an old video we posted a while back on the real Hunt Brothers story.
If you haven’t done so yet sign up below to receive our weekly article updates. That way you’ll be advised as soon as we update these NZ housing to gold and silver ratio charts.


Pingback: Another warning on interest rates and the NZ dollar | Gold Prices | Gold Investing Guide