|
Gold Survival Gold Article Updates
Jun. 26, 2014
This Week:
- Our New Website is Live
- Big move in Gold and Silver
- More Indicators of a Likely Bottom
- Wealth Inequality Getting Worse in NZ – So Tax the Rich?
- Wealth to Income Ratio: Predictor of Market Crash?
Our New Website is Live
This week we’ve launched our new (and hopefully improved!) website.
Visually it’s not dramatically different. The biggest changes are:
- A much improved menu layout which should make it easier to find things.
- A “responsive” design which means the site automatically adjusts to the screen size you view it on. So a much more pleasant viewing experience on a smartphone or tablet.
- A slightly different homepage layout with the latest prices of our most popular products scrolling through the header.
Have a look around and please reply to this email if anything seems to not be working as it should or if you find something confusing.
(Much like the tradesman who never finishes his own house, it’s taken us a while to finish updating our own website! (Our other business is online marketing for local businesses and we always seem to be doing someone else’s! By the way drop us an email or give us a call if you have a business yourself and want more leads as we may be able to help. Here’s our other website for Web & Mobile Marketing.)
Big Move in Gold and Silver
The short squeeze in gold and silver that we have mentioned over the past couple of weeks, seemed to arrive last Friday, with big moves in both metals. Since then prices have remained fairly flat.
Nonetheless since last week gold in NZ dollars is still up $45.06 per ounce or 3.07% to $1511.57. Unusually the US dollar gold price has gone up by about the same amount – up 3.18% to $1319. Showing the NZD is at about the same level as last week.
In the chart below you can see there is a fair bit of “clear sky” between where we are now and the NZ$1650 level. So if it manages to get above NZ$1550 we could see a fairly steady move higher. However with the price bumping up against the 200 day moving average (MA) it would not be surprising to see a sharp pull back from around here.

Silver had an even more powerful move this week, up NZ$1.26 per ounce or 5.51% to NZ$24.12. Or in US dollars silver is up $1.12 per ounce or 5.62% to $21.05.
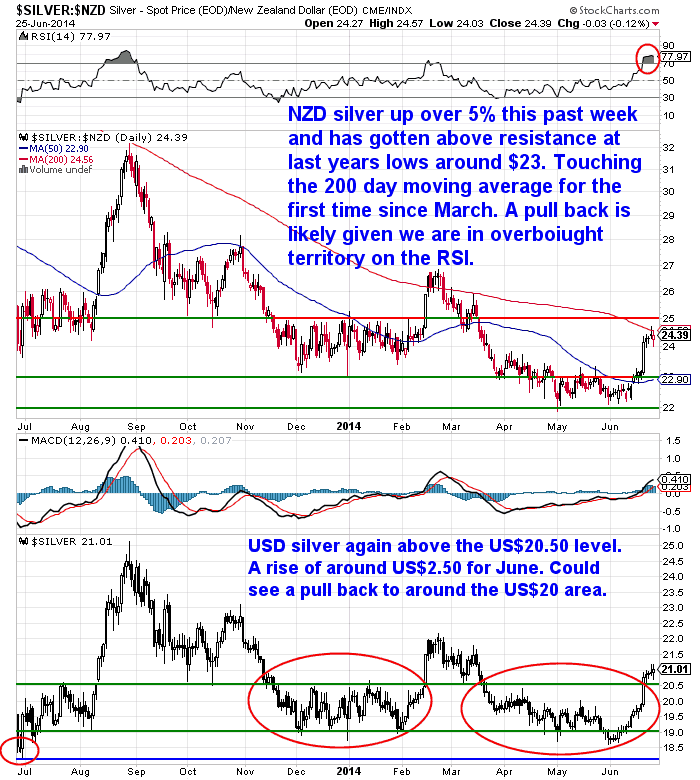
This move pushed silver up out of the range it has been in since late March. It too is touching the 200 day MA and unlike gold is way into overbought territory (see the RSI indicator at the top of the chart circled red – a reading about 70 is considered overbought) so ripe for a pullback now.
This move higher is also significant because it resulted in USD silver breaching the 3 and a bit year downtrend line since the highs of US$50 were reached in 2011.
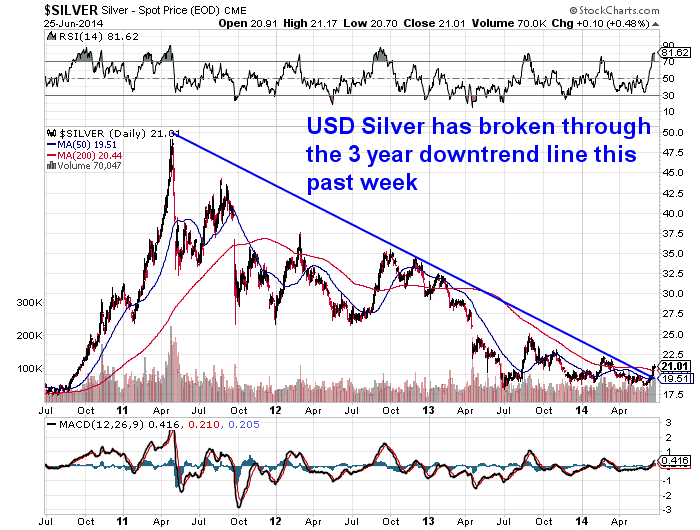
So the odds continue to lengthen that the bottom is indeed in for the precious metals.
More Indicators of a Likely Bottom
These sharp moves have also been largely ignored outside of the gold community. Here’s a recent Bloomberg headline for instance:
—–
Gold Euphoria Won’t Last With Yellen’s Rally Fading
“Prices will average $1,250 an ounce next quarter, about 5 percent less than now, according to the median of 15 estimates. The analysts were surveyed before and after the Fed’s June 18 outlook, and the forecast was unchanged. Even after a 28 percent plunge in 2013, the bears are emboldened by this year’s records in equity markets, and gold assets in exchange-traded products have shrunk to the smallest since 2009.
“The surge in gold can’t sustain itself,” Donald Selkin, who helps manage about $3 billion of assets as chief market strategist at National Securities Corp. in New York, said June 20. “It was a temporary spike because of a confluence of events: Iraq and Yellen. People will be looking at other areas for excitement. Holdings are down, so people are leaving gold in search of something better.”
—–
Also of note is that Gold ETF holdings last week dropped back to 2009 lows.
US gold coin sales are down 60% year to date compared to the same period last year.
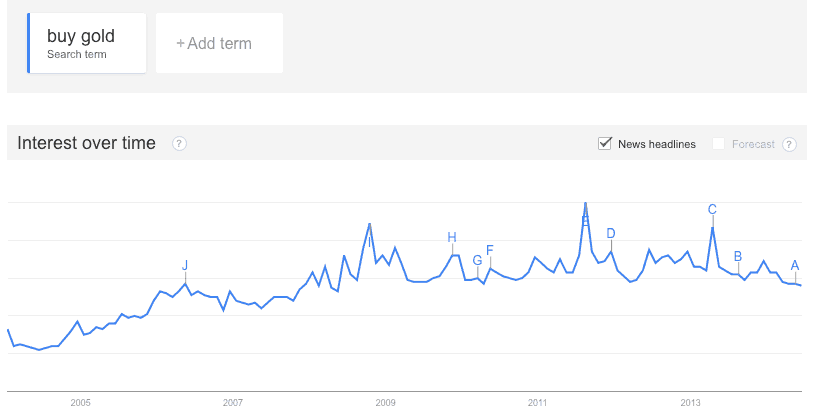
Google searches for “buy gold” have also plummeted interestingly back to 2009 levels as well.
On top of this it seems sentiment couldn’t be a lot worse:
Sentiment about gold has slipped to its lowest level since January, according to BullionVault.
—–
“The index stands at 52.5. A reading above 50 means there are more buyers than sellers. The index peaked in September 2011 at 71.7.
BullionVault’s research shows a diminished interest in gold going forward. “As a percentage of all English search terms worldwide, ‘buy gold’ is back to May 2009 levels according to Google data”.
Source.
—–
This matches with our Gold Survival Guide “index”. Well not an index as such but just noticeably much less buyers of late when compared to recent years.
All these points might seem like reasons not to be buying precious metals. However the time to buy insurance is when you don’t need it. And the time to buy is also when no one else is interested.
Wealth Inequality Getting Worse in NZ – Tax the Rich?
An economist at the Morgan Foundation this week wrote how wealth inequality in NZ is getting worse and the way to balance this is to not just tax income but also tax assets even if they don’t produce cashflow.
No arguments that wealth inequality is getting worse but why is this? And why will “taxing the rich” make this any better?
We think inequality is getting worse the world over due to central banking and low interest rates. After all who benefits the most from low interest rates?
Labour would argue that low interest rates benefit the poor since it makes hire purchases cheaper! This is the argument for their new Kiwisaver scheme where instead of raising interest rates when price inflation picks up they increase the compulsory Kiwisaver contributions to supposedly reduce the money in the economy. That is they will force you to save more.
Just the usual band aid stuff we come to expect from the politicians.
Of course those who benefit most from low interest rates are those with the biggest loans. Which would be the wealthiest with plenty of property and other leveraged assets. And those who own shares where businesses are more profitable due to the cheaper financing they can access to fund their businesses and/or even buy back their own shares.
We fail to see how even more taxes will “fix” things.
The problems lie at the core of our monetary system not just how we all get taxed.
Wealth to Income Ratio: Predictor of Market Crash?
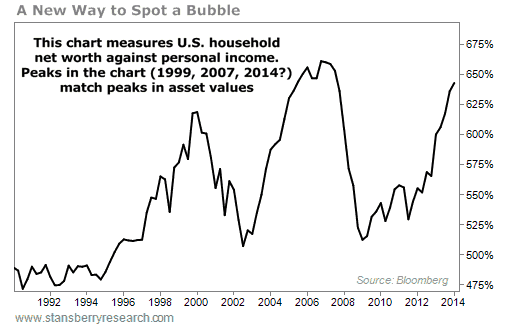
Also touching on the topic of wealth and income inequality was an interesting interview with Richard Duncan on The Stansberry Radio Network this week. He discussed the importance of tracking the Wealth to Income Ratio and how it can be an indicator of asset prices reaching bubble like tops. Interestingly the accompanying chart shows that stock markets could go higher yet though…
—–
“Stansberry: So here’s an interesting question. Do you think it is possible that we just simply haven’t seen the top of our bubble yet?
Duncan: Well… there has to be some connection between how high asset prices can go and the income of the public. If the ratio of wealth to income becomes too out of line, in other words, if asset prices inflate too much relative to the income of the public, then the people simply don’t earn enough money to pay the interest on the debt that they have used to finance the inflated asset prices.
Here is a problem…
I look at the ratio of household sector net worth to personal disposable income. In other words, wealth to income. Now, going back to 1950, this has averaged something like 525 percent over all of those years. But during the NASDAQ bubble, it went up all the way to 616 percent. Then that popped, and it went back to its normal level. Then during the property bubble of 2005, ’6, and ’7, it went up all the way to 660 percent. Then of course that popped, and it went back to its normal range.
Now it’s all the way back up to 640, quite near an all-time high, and that suggests that asset prices are moving too much out of line relative to income. So there does to be some limit as to how much longer perhaps the Fed will be able to continue driving economic growth by inflating asset prices by printing money.
—–
Crux note: Richard says one of the hallmarks of a bubble economy is when asset prices rise faster than wages. In a recent edition of the S&A Digest, Porter tested how well this ratio predicted recent U.S. bubbles. He and his team built a chart that measured the last 20 years of U.S. household net worth (assets) versus disposable income (wages). Here’s what it revealed:
“This ratio peaked in 1999 and stocks blew up in early 2000. This ratio peaked in 2007, and stocks blew up in 2008. The ratio is now almost to the same point it was in 2007, and it’s higher than it was in 1999. But it hasn’t “rolled over yet.” This tells me that while assets (like stocks, bonds, and real estate) have gotten far too expensive relative to wages in the U.S., they could still go higher before the stock market crashes again.”
Source.
—–
Classic Line of the Week
Classic line of the week goes to the head of ANZ commenting on Peer to Peer (P2P) lending – something the banks should be very scared of even if he plays it down.
He reckons P2P might not be as easy as it looks.
—–
“We just want to monitor it and see how it goes,” Hisco told interest..co..nz in an interview.
“I think there’s a reason for why banks exist. Other people try and lend money here and there, but generally they don’t have the scoring systems…And then there’s the issue of if you get too big you’ll be heavily regulated. You won’t be allowed to run around and do what you like.”
Source.
—–
There is definitely a reason why banks exist and it’s not because they are good at “scoring risk”. We’d say it’s because they have managed to ensconce themselves at the root of the monetary system and are in a heavily regulated industry that allows for few if any competitors to break into it. Others are simply not allowed to lend money.
This regulation that is meant to protect people, as is usually the case, results in them being worse off due to the lack of entry by new entities and therefore lack of innovation. The head of ANZ points out that if you get too big you’ll get heavily regulated. We’re sure the banks will be pushing behind the scenes for P2P to have plenty of regulation thrown at it and restrict their monopoly on money.
We hold out hope for competition in money (as we discuss in this article: The Gold Standard: What Do We Think About it?). But fear it might be a way off yet. In the meantime we continue to hold gold and silver as insurance against the next inevitable phase of the death of money.
If you’re yet to own financial insurance, any pull back we get in the next week or 2 after this weeks jump higher, may be an excellent long term entry point for gold and silver we reckon. You know where to find us if you have any questions.
This Weeks Articles:
A Central Banking Extravaganza |


 2014-06-19 02:03:23-04Gold Survival Gold Article Updates: June 19,2014 This Week: A Central Banking Extravaganza! A Correction on Negative Interest Rates Gold and Silver Surprisingly Rise on Fed Ongoing “Taper” A Fake Taper? Central Banks Buying Stocks Precious Metals Pricing Moving to the East? As the title to this email said, this week we do have a […]
 2014-06-24 23:50:03-04In our newsletter last week we discussed how the Fed tapering” may not really be a taper at all.” This piece from Bud Conrad looks at how the Fed might actually be stealthily withdrawing liquidity in other ways. This was one of the most interesting things we’ve read this week and not something we’e seen discussed anywhere else […]
 2014-06-25 00:48:05-04One of the most common questions we get is “should I buy gold or silver?”. There is no hard and fast answer and no right or wrong answer since no one knows what the future holds. However there are pros and cons to both. In the below video you’ll hear from Mike Maloney Author of […]
 2014-06-25 17:42:07-04The folks at Casey Research are very bullish on platinum and palladium currently. Last month they ran through 6 reasons why there are structural supply problems that will likely mean prices rising in the next number of years: Platinum & Palladium: The Birth of a New Bull Market. The problem is there aren’t too many mining […]