
Learn all about the gold and silver commitment of traders (COT) report and how understanding it can help determine when to buy gold and silver.
This post covers:
- What is the Commitment of Traders (COT) Report?
- The Current Positions in the Commitment of Traders Report for Gold and for Silver
- What is a “Short Squeeze”?
- What is “Short Covering”?
- Is a Gold and Silver Short Squeeze Coming?
Table of contents
- What is the Commitment of Traders (COT) Report?
- What are the Current Positions in the Commitment of Traders Report for Gold?
- What are the Current Positions in the Commitment of Traders Report for Silver?
- What is “Short Covering”?
- What is a “Short Squeeze”?
- Is a Gold and Silver Short Squeeze Coming?
- Historically High “Dumb Money” Positions Indicate A Good Time to Buy Gold and Silver
Estimated reading time: 9 minutes
What is the Commitment of Traders (COT) Report?
COTs = Commitment of Traders Report
The Commitment of Traders (COT) Report tracks the positions of gold and silver futures traders. It reports whether they are long or short – i.e. betting that prices will rise or fall respectively.
In the report these futures traders get grouped according to who they are. For example, Managed Money (hedge funds and the like), or Commercials (commercial hedgers such as miners, actual users of metal etc – usually the “smart money’). Along with Swap Dealers (a.k.a. bullion banks).
So the positions of these respective groups can be useful particularly at extremes as indicators of where gold and silver prices may soon be about to head. More on that below.
A Quick Glossary of the COT Report Data
The COT report is published by the US Commodity Futures Trading Commission (CFTC).
Here’s an example of what this data looks like: http://www.cftc.gov/dea/futures/other_lf.htm
The report basically categorises traders in various commodities, into different categories and monitors the size of the positions taken. From this it can be determined whether these different groups are betting on the price of silver and gold going up (long) or going down (short).
That is really an oversimplification. As some of these traders, such as silver and gold miners or users, or bullion banks might not actually be betting on the price falling when they “go short”. But could just be hedging positions they have in actual physical gold and silver.
But we’ll leave it at that to not overcomplicate things.
What are the Current Positions in the Commitment of Traders Report for Gold?
Managed Money Traders Current Position in Gold Futures
Currently in gold the Managed Money are short (which is very unusual in itself). But not only that, the Managed Money are also at all time record high short levels. The chart below is dated 22 July and the short position has now extended out to 111,309 for the most recent data published 26 July 2022. So managed money short positioning has only been higher than this on 3 occasions since 2007. This position is 3.6 times higher than the median long term position.
Why is this important?
Because the Managed Money (hedge funds and the like) are usually wrong at the extremes. That is, historically their overall long position is usually high at tops in silver or gold (they’re all betting the price will rise). And usually low at bottoms (they’re betting the price will fall further). But currently they are more extreme than that and their overall positions are actually net short. With the gold and silver price having already corrected significantly since 2020.
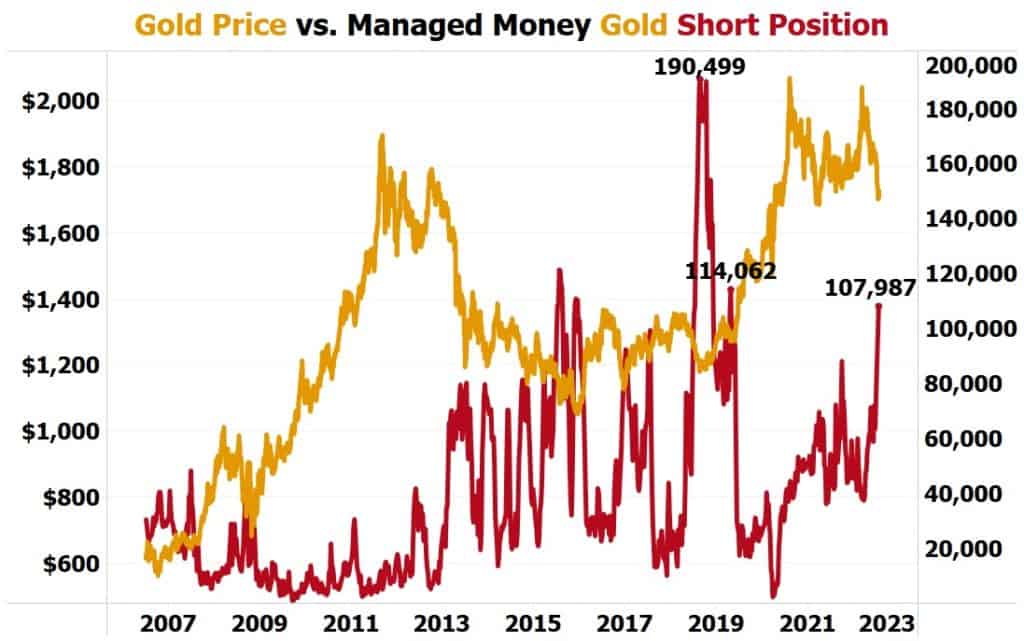
Here’s another key point to consider:
“The last time gold’s managed money short position was this high on May 21, 2019, when it hit 99,049 contracts, gold gained by 5.73% within one month and gained by 36.38% within twelve months!”
Source.
Commercial Traders and Bullion Banks Current Position in Gold Futures
Conversely the Commercial traders and bullion banks net short position in gold is currently very low historically. So they think prices are likely to rise from here. These producers/end users of gold are usually right at the extremes. The Commercials/bullion banks usually have a higher net short position when prices are peaking as they are hedging themselves against the price falling.
Currently these hedgers are doing just the opposite. They are now only around 100,000 contracts net short. The chart below shows gold hedgers are once again approaching levels we saw at key turns in the gold price in 2015 and 2018/19. (Note: the hedgers position in the chart below is usually negative – indicating they are long – so hence when the blue line is higher, this indicates a lower short position.)
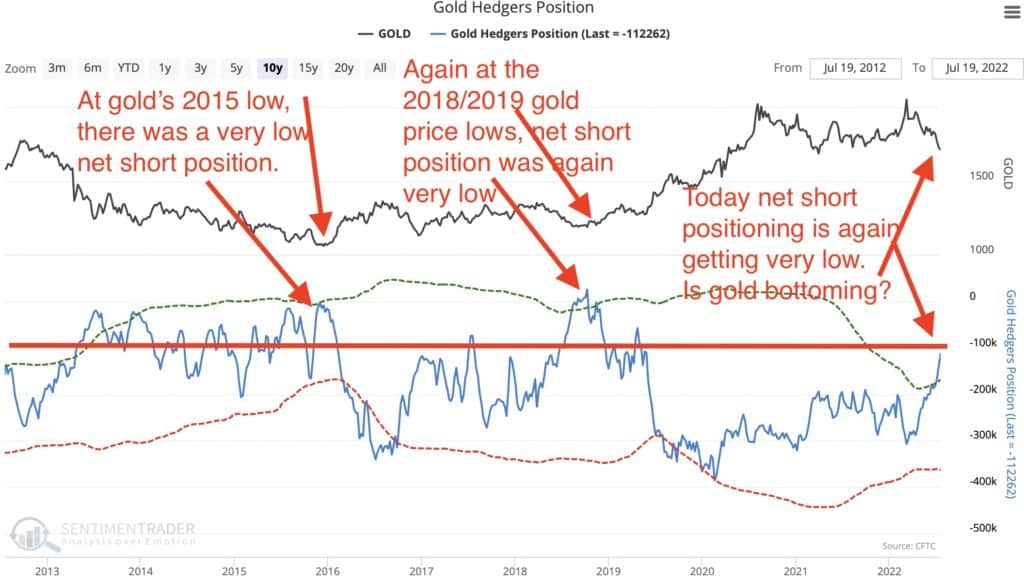
So the “smart money” in gold is betting on the price rising. Bear in mind these are the industry players who usually hedge their exposure to physical gold by being short gold. This is a very significant change.
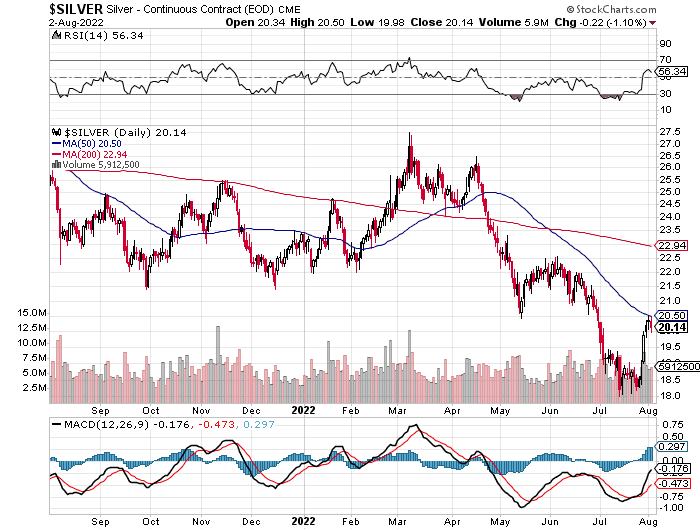
What are the Current Positions in the Commitment of Traders Report for Silver?
Commercial Traders and Bullion Banks Current Position in Silver Futures
The positioning of the commercial hedgers in silver is even more extreme than in gold. Commercial traders and bullion banks short positions have only been lower than this a handful of times in the past decade. Most notably at the 2018 low in the silver price

Latest numbers from 26 July 2022 COT Report
The latest numbers out in the 26 July 2022 COT report show the short position was even lower. Now at just -2653 contracts. So silver hedgers are very close to going long in silver (that is when the net position turns positive). Something that only happened for the first time in 2018.
The COT data is always a week behind so we won’t know until 5 August what has happened in the last week.
Our favourite newsletter writer Chris Weber shared a comment from one of his readers who closely follows the COT report.
Quoting a 2005 book by Larry Williams: “Trade Stocks and Commodities with the Insiders: Secrets of the COT Report”
The quote was:
“If you ever see the commercials go net long silver, look for a major bull market”.
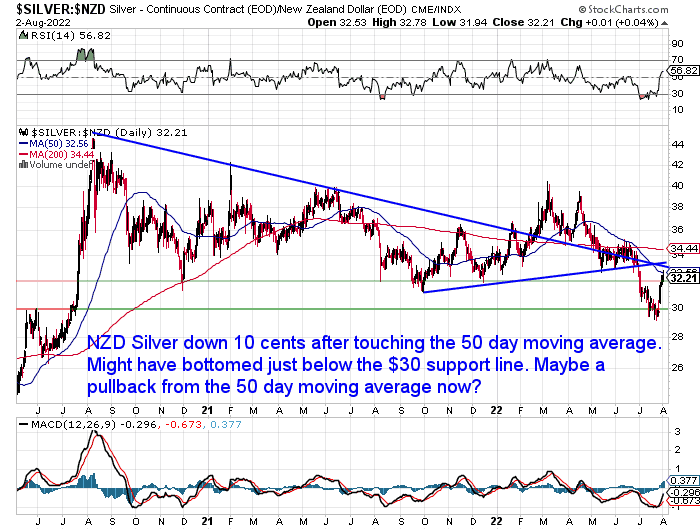
Silver may well have bottomed at the end of last week. Jumping higher by 81 cents (over 4%) on Friday.
So it will be interesting to see if the silver hedgers once again getting close to a net long position, is as significant as the quote from the book reckons it will be. We are still watching to see if a short squeeze will soon occur. More below on that…
What is “Short Covering”?
When analysts and armchair writers such as us talk about “short covering”, this simply means futures traders have closed out their short positions (bets on the price falling). They have to actually “go long” in order to do this. These traders are closing their shorts because they believe the price is moving against them and heading higher.
What is a “Short Squeeze”?
This is how a “short squeeze” can occur. A short squeeze occurs when there is an extreme number of short positions being closed, often at a loss. So as a result the gold and silver price can jump suddenly higher, as the shorts then buy in order to get out before their losses mount. Thereby driving the price even higher.
You can see very sharp jumps in the price when a short squeeze occurs.
Is a Gold and Silver Short Squeeze Coming?
The Managed Money currently has, what are historically, very high short positions in gold. While the Commercial Hedgers have now got very low short positions in both gold and silver. In silver the hedgers have only been lower than this a few times in the past decade.
The former (Managed Money) are usually wrong at the extremes. While the latter (Commercial traders and bullion bank hedgers) are usually right.
But for a number of weeks now gold has continued to fall and the managed money has kept piling on shorts and making more money as the price kept falling.
But at some point this will reverse and there will be no one left willing to go short.
This is when the short squeeze will occur. We’ll see the managed money having to exit their shorts as the gold price and silver price rises. They will do this by taking long positions. Thereby boosting the price further.
Has a Short Squeeze Started Already?
This short squeeze may have started last Friday when gold rallied by $21 to $1,755.93 per oz.
As noted already, the managed money category now have what is historically a very high short position (i.e. they are betting on gold falling).
Here’s a key point to consider:
“The last time gold’s managed money short position was this high on May 21, 2019, when it hit 99,049 contracts, gold gained by 5.73% within one month and gained by 36.38% within twelve months!”
Source.
We will now watch to see if further jumps in the gold and silver price occur.
Historically High “Dumb Money” Positions Indicate A Good Time to Buy Gold and Silver
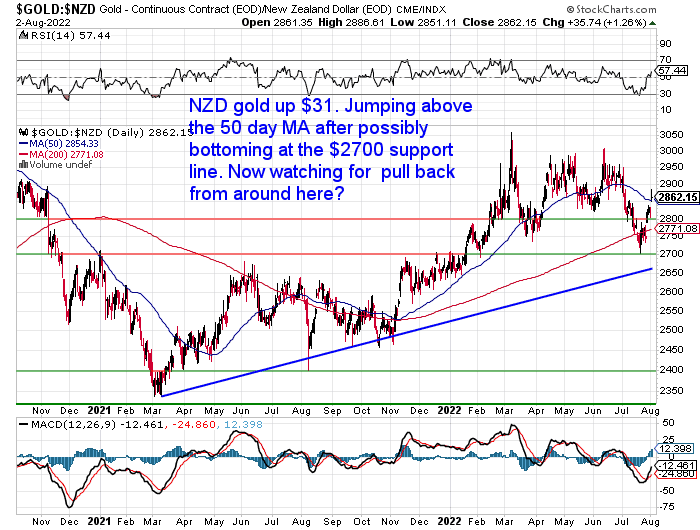
Indeed it would be wise to at least take note of what the “smart money” is doing. With gold and silver prices here in New Zealand possibly putting in lows last week, now could be a very opportune time to grab some financial insurance. Just in case the “smart money” is right and the “dumb money” is again wrong.
Visit this page for more information on how to buy gold and silver.
Or see what precious metals products are available to buy here.
Editors Note: Originally posted 28 August 2018. Fully updated 3 August 2022 with all the latest gold silver positions for managed money and commercial traders/bullion banks. Along with all new charts including NZD gold and silver charts.
Pingback: What Does Short Covering Mean for the Price of Silver? - Gold Survival Guide
Pingback: Gold & Silver: COT Report Nirvana
Pingback: Silver Short-Squeeze Potential - Gold Survival Guide
Pingback: Latest on the COMEX Silver CoT Report - Gold Survival Guide
Pingback: Fed Rate Hikes and Gold Prices - Interesting Research
Pingback: What is COT's? - Gold Survival Guide
Pingback: Why Did COMEX Silver Derivatives Increase 41% in 2016? - Gold Survival Guide
Pingback: Is Now a Good Time Buy Gold in New Zealand? - Gold Survival Guide
Pingback: Where Are We in the Psychology of the Silver Market Cycle? - Gold Survival Guide
Pingback: Has Gold (and Silver) Turned the Corner?
Pingback: Infographic: Bullion Banking Mechanics - Gold Survival Guide
Pingback: Has the Silver Breakout Started? Why a Short Squeeze Could be Developing - Gold Survival Guide
Pingback: The Anatomy of a (New) Gold Bull Market: Prices Rises. Short Correction. Bigger Rise to Come? - Gold Survival Guide
Pingback: Supply Update and a Contrarian Indicator - Gold Survival Guide
Pingback: Silver Versus the World (and Exter’s Inverted Liquidity Pyramid) - Gold Survival Guide
Pingback: Flash Crash in Silver & a Tale of Two Gold Markets - Gold Survival Guide