
We’ve been commenting lately that gold (and now more recently silver) seems to be surprising many people by continuing to rise, with very little in the way of pull back.
We thought this recent post by Stewart Thomson was worth sharing as he covers a number of factors that are occurring in the precious metals markets currently that may be contributing to their strength…
By: Stewart Thomson
- Gold continues to astound most analysts, as it moves relentlessly higher. Please see below. Double-click to enlarge this daily gold chart.

- The triangle pattern in bullish play is perhaps best described as an “Ode To Awesomeness”. Note the inverse head and shoulders bottom pattern that has appeared. That should help drive the price up and out of the triangle pattern, to my $1305 target area.
- It feels like the bullion banks barely finish settling one price manipulation lawsuit, and then another begins. Please see below. Scotiabank, which is also facing lawsuits for price manipulation in the United States, is now facing a massive class action lawsuit in Canada.

- Please see below.
 While the bullion banks of the West are facing a barrage of lawsuits, China has launched the SGE gold price fix system, and the launch may be part of the reason gold is moving strongly higher this morning.
 - Please see below. Although the trading departments of many banks are facing lawsuits for manipulation, many bank analysts are doing superb research, and Joni Teves at UBS is one of them.
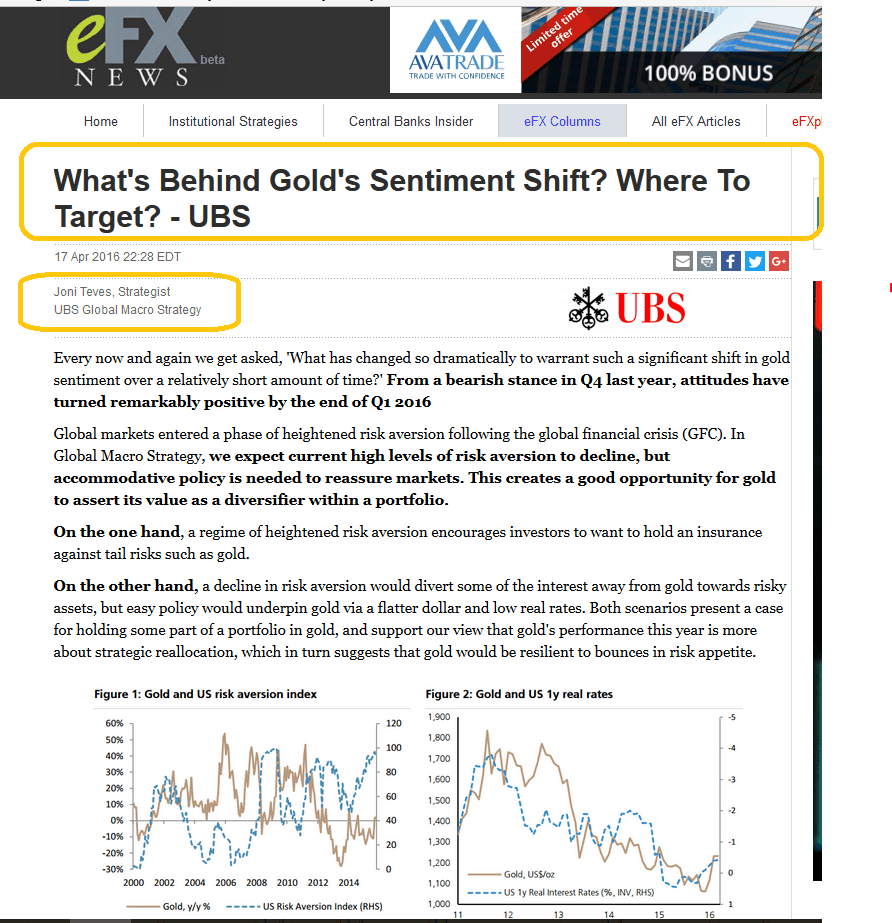
- The UBS Global Macro department research team can move significant institutional liquidity flows with its reports, and Joni is clearly very positive about gold right now.
- Please see below. Not to be outdone, technical analysts at HSBC have set a $1500 target for gold!
- In late 2015, the price of sugar began to rise. I’ve noted that significant rallies in sugar tend to lead quite dramatic rallies in silver.
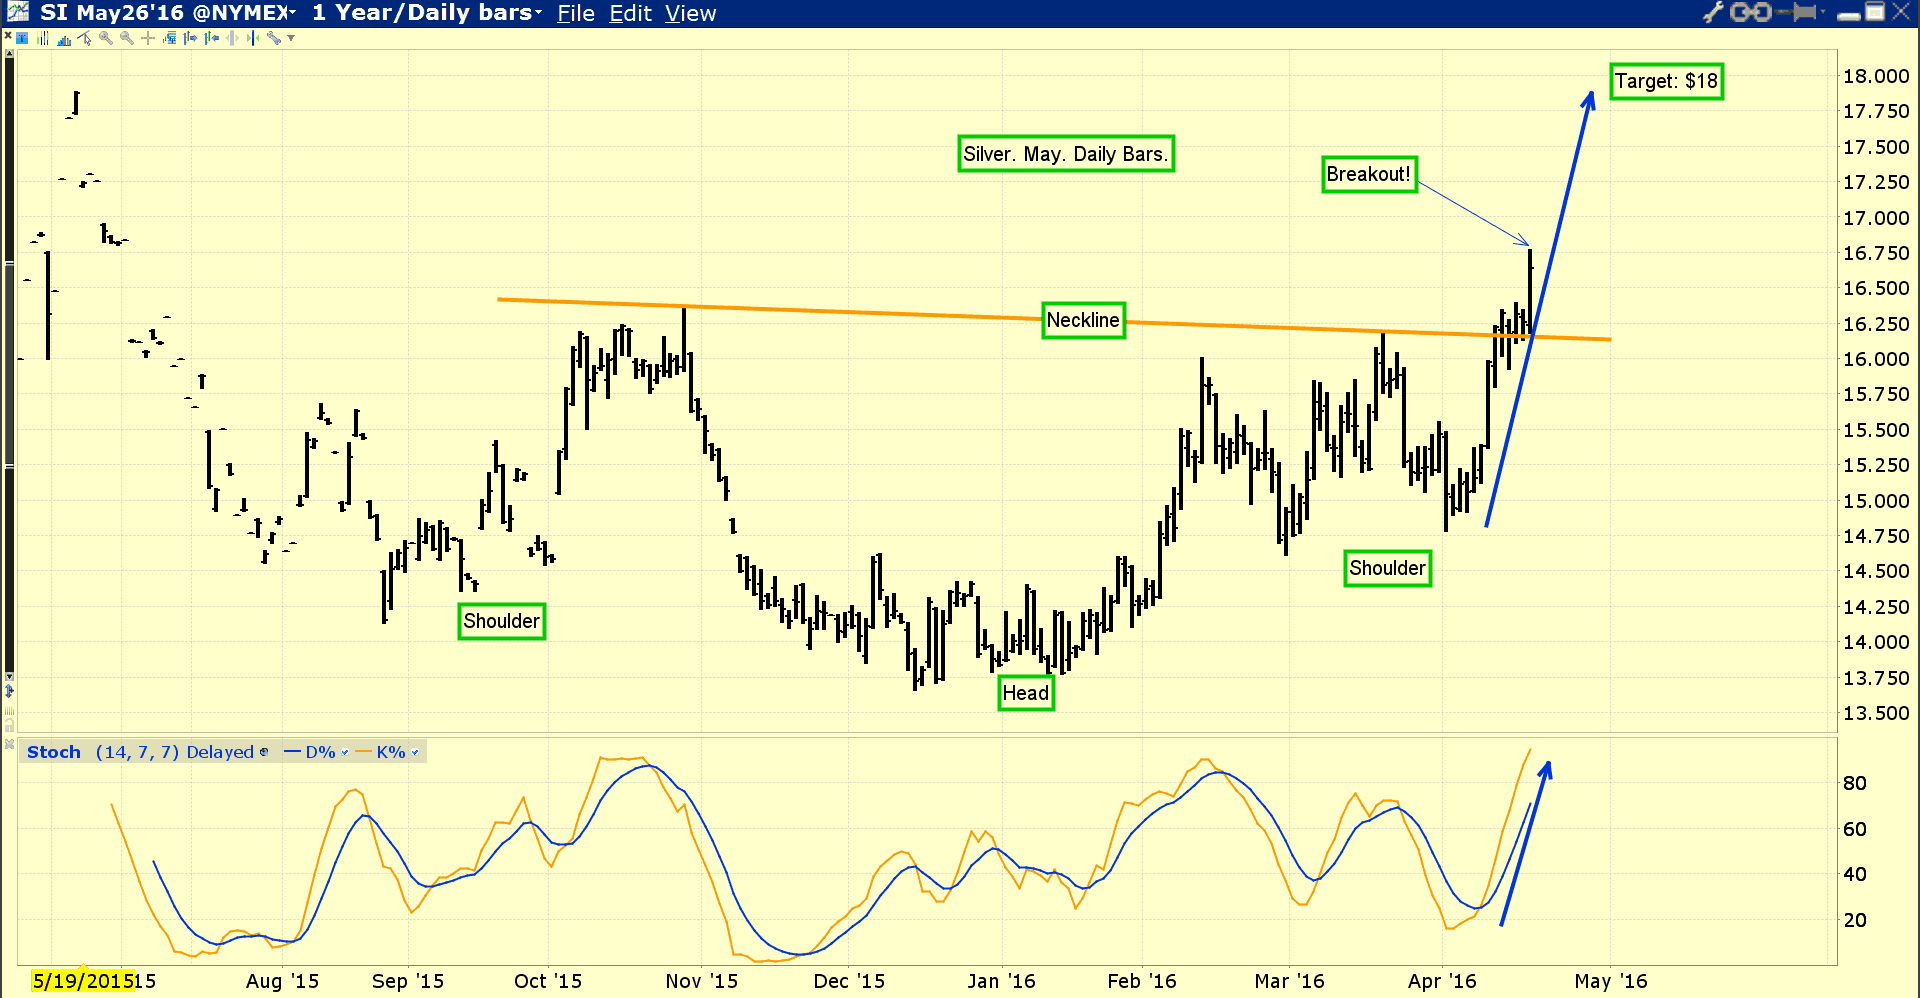
- Sugar has started to rally again. Is silver poised to follow, and launch a “barnburner” type of upside rally? For the possible answer to that question, please see below. Double-click to enlarge. This daily chart of silver looks spectacular!
- The breakout this morning is likely SGE-related, and there’s an outside possibility that Scotiabank is winding down some short silver trades, to do in-house window dressing for the lawsuit.
- Regardless, I think the entire Western silver community deserves a real “Wheeeeeeeeeeeeee!” moment in time. That time is likely here! From a technical standpoint, silver is staging a significant breakout from a large inverse head and shoulders bottom formation.
- Over the years, I’ve argued emphatically that the entire Western gold and silver community should generally avoid the action of “chasing price”, but if ever there was a time to do so, it’s right now.
- With the “blastoff” action in play in the silver market this morning, momentum enthusiasts should be ready to buy the breakout right now.
- I have a short-term target of $18, and if China’s soft landing morphs into the soft upside takeoff that I’m projecting, silver could move towards $25 and gold towards $1500.
- I will note that bank and IMF economists are already revising their GDP numbers for China to the upside, and rightly so.
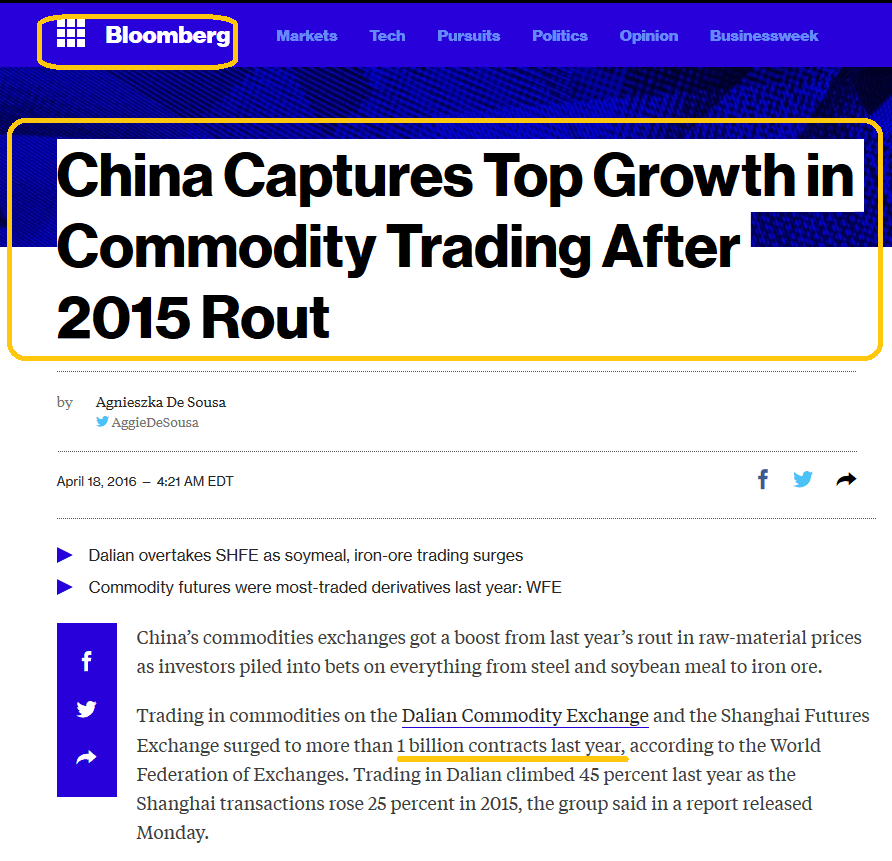
- Please see below. Commodity trading is surging in China again.
- The jeweller strike is over in India, and the Akshaya Tritiya festival is approaching. Indian buying may also be a factor in this morning’s price action.
- That’s not really important. What’s very important is the approach of a good monsoon season, against the background of real world-leading GDP growth.
- Gold demand in India is set for a significant long-term rise, and with each day that passes, the SGE in China is going to work tirelessly to make price discovery better reflect real physical demand versus real physical supply. It’s not an event. It’s a process, and a very positive one for the long-term price of gold!
- Please see below. Double-click to enlarge this dollar versus yen daily chart. The main reason I sold a third of my physical silver for gold in 2011 was the “risk-on” signal being flashed by the US dollar against the yen.

- I bought that silver back in 2014, as the dollar began to peak against the yen, flashing a significant “risk-off” signal for the world. As one example, the US stock market rose strongly in the 2011 – 2014, and has since acted more like a wet noodle. The risk of an American stock market crash is now quite high.
- I think the USD-yen relationship is on the verge of changing, because the fundamentals of the relationship are changing. The Abe/Kuroda team in Japan seem obsessed with managing a government debt crisis by raising taxes, buying stock market ETFs with more printed money, and perhaps reneging on principal payments to bondholders, after taking interest rates into negative territory.
- The citizens of Japan are the world’s largest creditors, but their government is one of the world’s largest debtors. The debtors refuse to reduce debt and are engaging in reckless fiscal policy. This may be creating a situation where the next major rally in the dollar against the yen is not a risk-on signal for global stock markets, but a buy signal for gold!
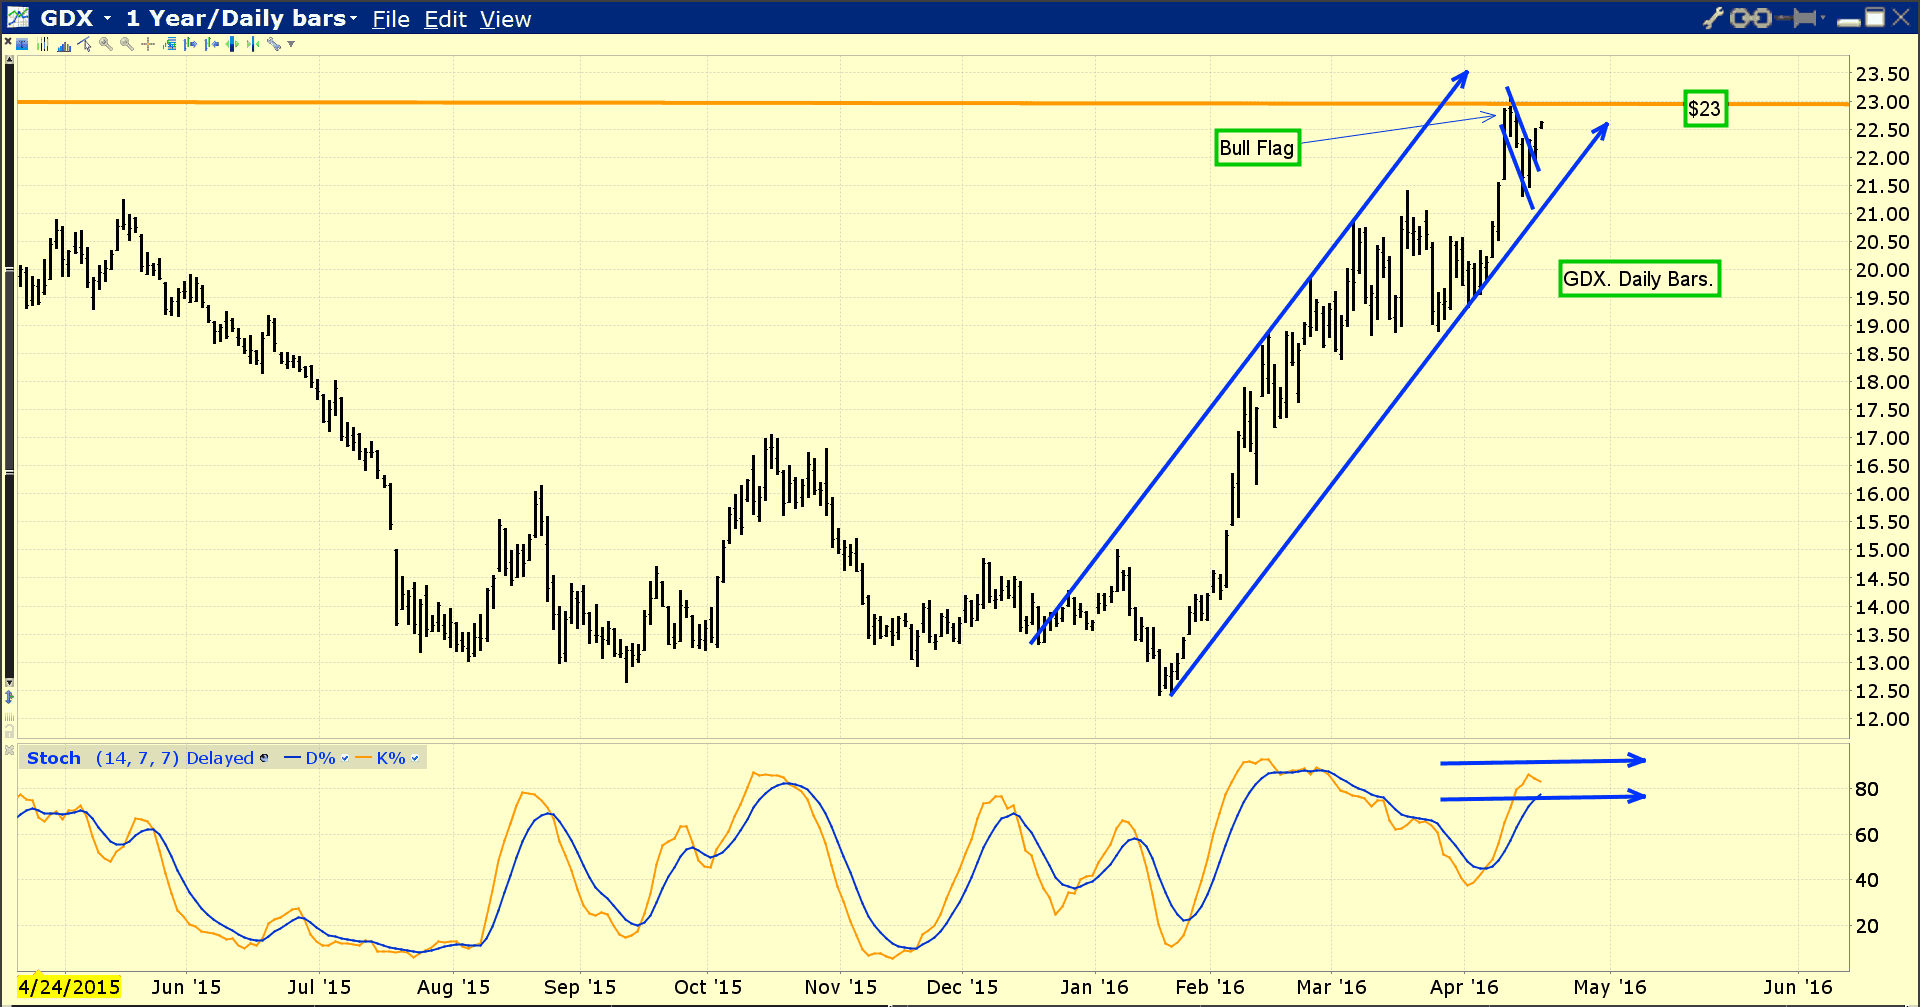
- Please see below. Double-click to enlarge this fabulous GDX daily chart. Gold stock enthusiasts should watch the $23 area closely. GDX is rising up from a bull flag pattern. If it moves above $23, the door is technically open, for a surge to my $28 -$30 target!
Thanks!
Cheers
Stewart Thomson
Graceland Updates
Email: stewart@gracelandupdates.com