This Week:
- A Chart-apallooza or Chart-fest
- Making Sense Of The Sudden Market Plunge
- Ray Dalio on Interest Rates and More QE
- How Much Gold (or Silver) Should You Have?
Prices and Charts
| Spot Price Today / oz | Weekly Change ($) | Weekly Change (%) | |
|---|---|---|---|
| NZD Gold | $1750.74 | + $27.36 | + 1.58% |
| USD Gold | $1225.20 | – $9.20 | – 0.81% |
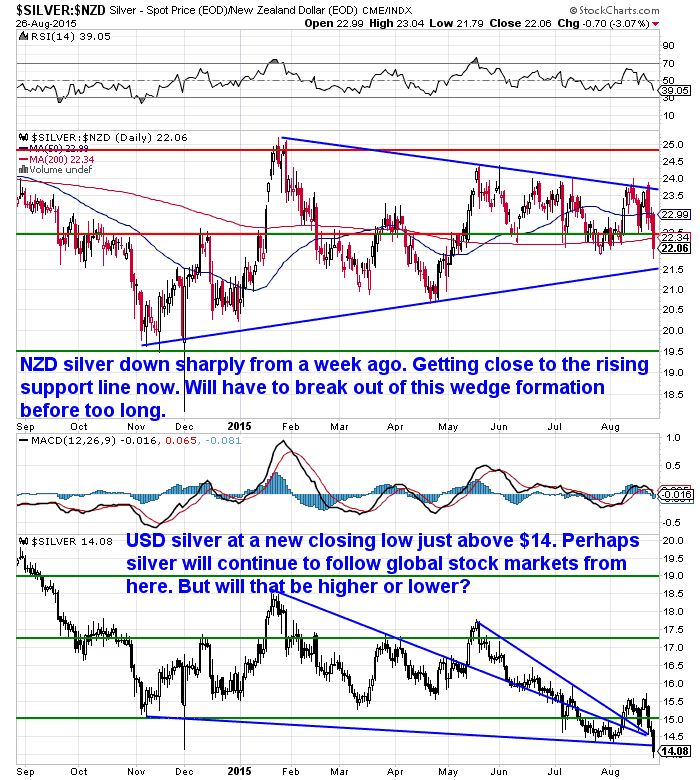
| NZD Silver | $22.06 | – $1.26 | – 5.40% |
| USD Silver | $14.18 | – $1.17 | – 7.62% |
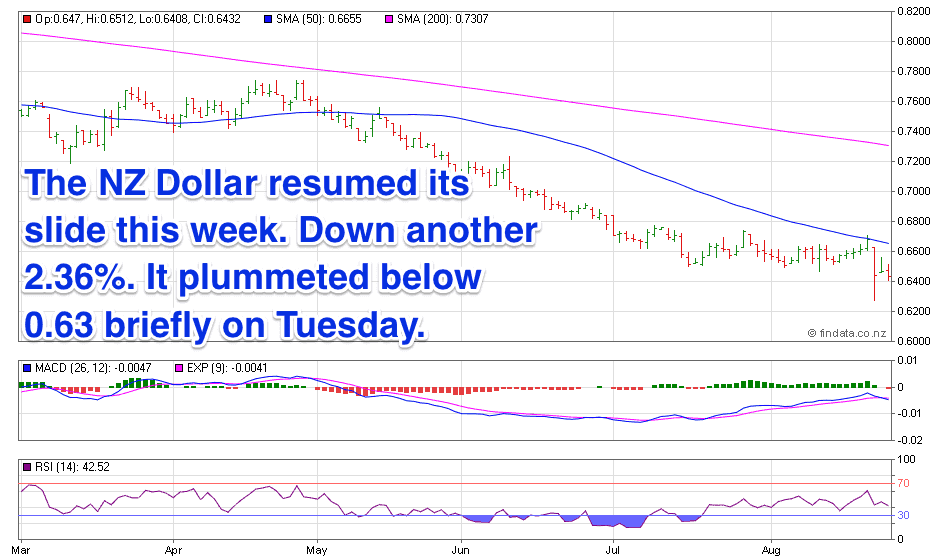
| NZD/USD | 0.6427 | – 0.0156 | – 2.36% |
So, enough action in that week in the global economy for you?
Massive down days in global stock markets interspersed with some large bounces. Gold has risen but has since pulled back a bit. Silver has fallen.
Shades of 2008 perhaps?
What’s the cause of this volatility?
The mainstream line from what we’ve read seems to blame it all on China’s stockmarket. That seems a rather large over simplification to us.
 We have an article posted on the site by Chris Martenson which does a much better job of explaining things we reckon.
It looks at how markets are completely broken, how and why emerging markets have been hit first, and why currencies and stock markets are falling.
Making Sense Of The Sudden Market Plunge
Gold and Silver Charts
Gold (finally) acting as a safe haven again, surging higher while stock markets everywhere plunged this week.
In New Zealand dollar terms gold reached its highest level in almost 2 years. It has since backed off but possibly broken higher. We will need to see it get solidly above NZ$1800 now.

Definitely shades of 2008 for silver. While gold rose during the week, silver plunged 5.40% in NZ dollar terms this week. So acting much like it did back then and following shares and commodities lower. The question now is will it continue to do this or take a lead from gold at some stage soon?
The NZ Dollar resumed its slide this week. Intraday Tuesday it actually plunged right down below 63 cents before staging a reversal. Who knows whether that was a bottom for it or not. At some point this US Dollar strength will have to end, but who knows if we are there yet.
Gold and Silver Chart-fest
We thought the week’s action was well summed up visually. So we have a feature article this week looking at various measures in chart form. Now while there is an argument that in these days of manipulated markets, what use is technical analysis?
But charts still show us where the price has been, both recently and on an historical basis. So they can at least give us some clues as to where we could go from here.
 In this article we look at:
- The Dow/Gold Ratio
- The Gold/Silver Ratio
- The NZ Housing to Gold Ratio
- Gold and Silver Charts in NZ Dollars
- Gold Mining Shares
 We’ll keep this weeks email brief as there are plenty of articles on the site for you to dig into already. Plus a video interview with our “favourite billionaire” Hugo Salinas Price. interesting that he thinks the next rise in gold will be its last. See why…
Hugo Salinas Price: We’re Going to be Drowning in Worthless Paper
Preparation also means having basic supplies on hand.
Are you prepared for when the shelves are bare?
For just $265 you can have 1 months long life emergency food supply.
Learn More.
—–
Ray Dalio on Interest Rates and More QE
Hedgefund manager Ray Dalio who recently stated “If You Don’t Own Gold, You Know Neither History Nor Economics“, this week released his latest letter to his clients.
In it he laid out why he believes the Federal Reserve should be looking to engage in further money printing, rather than raise interest rates in short term. He believes deflation is the big risk at the moment and if the Fed does tighten it will spell trouble.
Business Insider published part of this letter yesterday and we think it is worth printing in full here:
“As you know, the Fed and our templates for how the economic machine works are quite different so our views about what is happening and what should be done are quite different.
To us the economy works like a perpetual motion machine in which short-term interest rates are kept below the returns of other asset classes and the returns of other asset classes are more volatile (because they have longer duration) than cash. That relationship exists because a) central banks want interest rates to be lower than the returns that those who are borrowing to invest can generate from that borrowing in order to make their activities profitable and b) longer-term assets have more duration that makes them more volatile than cash, which is perceived as risk, and investors will demand higher returns for riskier assets.
Given that, let’s now imagine how the machine works to affect debt, asset prices, and economic activity.
Because short-term interest rates are normally below the rates of return of longer-term assets, you’d expect people to borrow at the short-term interest rate and buy long-term assets to profit from the spread. That is what they do. These long-term assets might be businesses, the assets that make these businesses work well, equities, etc. People also borrow for consumption. Borrowing to buy is tempting because, over the short term, one can have more without a penalty and, because of the borrowing and buying, the assets bought tend to go up, which rewards the leveraged borrower. That fuels asset price appreciation and most economic activity. It also leads to the building of leveraged long positions.
Of course, if short-term interest rates were always lower than the returns of other asset classes (i.e., the spreads were always positive), everyone would run out and borrow cash and own higher returning assets to the maximum degree possible. So there are occasional “bad” periods when that is not the case, at which time both people with leveraged long positions and the economy do badly. Central banks typically determine when these bad periods occur, just as they determine when the good periods occur, by affecting the spreads. Typically they narrow the spreads (by raising interest rates) when the growth in demand is growing faster than the growth in capacity to satisfy it and the amount of unused capacity (e.g., the GDP gap) is tight (which they do to curtail inflation), and they widen the spreads when the opposite configuration exists, which causes cycles. That’s what the Fed is now thinking of doing—i.e., raising interest rates based on how central banks classically manage the classic cycle. In our opinion, that is because they are paying too much attention to that cycle and not enough attention to secular forces.
As a result of these short-term (typically 5 to 8 year) expansions punctuated by years of less contraction, this leveraged long bias, along with asset prices and economic activity, increases in several steps forward for each step backwards. We call each step forward the expansion phase of each short-term debt cycle (or the expansion phase of each business cycle) and we call each step back the contraction phase of each short-term debt cycle (or the recession phase of the business cycle). In other words, because there are a few steps forward for every one step back, a long-term debt cycle results. Debts rise relative to incomes until they can’t rise any more.
Interest rate declines help to extend the process because lower interest rates a) cause asset prices to rise because they lower the discount rate that future cash flows are discounted at, thus raising the present value of these assets, b) make it more affordable to borrow, and c) reduce the interest costs of servicing debt. For example, since 1981, every cyclical peak and every cyclical low in interest rates was lower than the one before it until short-term interest rates hit 0%, at which time credit growth couldn’t be increased by lowering interest rates so central banks printed money and bought bonds, leading the sellers of those bonds to use the cash they received to buy assets that had higher expected returns, which drove those asset prices up and drove their expected returns down to levels that left the spreads relatively low.
That’s where we find ourselves now—i.e., interest rates around the world are at or near 0%, spreads are relatively narrow (because asset prices have been pushed up) and debt levels are high. As a result, the ability of central banks to ease is limited, at a time when the risks are more on the downside than the upside and most people have a dangerous long bias. Said differently, the risks of the world being at or near the end of its long-term debt cycle are significant.
That is what we are most focused on. We believe that is more important than the cyclical influences that the Fed is apparently paying more attention to.
While we don’t know if we have just passed the key turning point, we think that it should now be apparent that the risks of deflationary contractions are increasing relative to the risks of inflationary expansion because of these secular forces. These long-term debt cycle forces are clearly having big effects on China, oil producers, and emerging countries which are overly indebted in dollars and holding a huge amount of dollar assets—at the same time as the world is holding large leveraged long positions.
While, in our opinion, the Fed has over-emphasized the importance of the “cyclical” (i.e., the short-term debt/business cycle) and underweighted the importance of the “secular” (i.e., the long-term debt/supercycle), they will react to what happens. Our risk is that they could be so committed to their highly advertised tightening path that it will be difficult for them to change to a significantly easier path if that should be required.”
Remember this is from a guy who has made 13% a year since 1975 and manages $170 Billion! We prefer to listen to him than bank economists and financial journalists.
If you’d like to learn more about his theory on how the global economy currently works and how this leads his thinking he has a great 30 minute video available on Youtube. Click the image below to watch:

How Much Gold (or Silver) Should You Have?
If you’re new to the world of precious metals, a common question to ask is “How much gold and/or silver should I have?”
 We hear this often, but of course it is a very individual question that is impacted by many variables like age, net worth, other assets etc.
We have an article posted on the site that looks at a couple of scenarios that might help you determine what percentage of your net worth you should have in precious metals.
The Risky Investment that Could Make You Millions in the Next Financial Crisis
As we note in our feature article this week, the odds are things are about to get a lot more interesting in the coming weeks and months, after a number of years of relative calm.
If you’ve worked out how much “financial insurance” you need, but need a hand working out what type you need then please get it touch to see what options you have.
Free delivery anywhere in New Zealand and Australia
We’ve still got free delivery on boxes of 500 x 1oz Canadian Silver Maples delivered to your door via UPS, fully insured.
Todays price is $14,225 and delivery is now about 7-10 business days.
— Prepared for Power Cuts? —
[New] Inflatable Solar Air Lantern
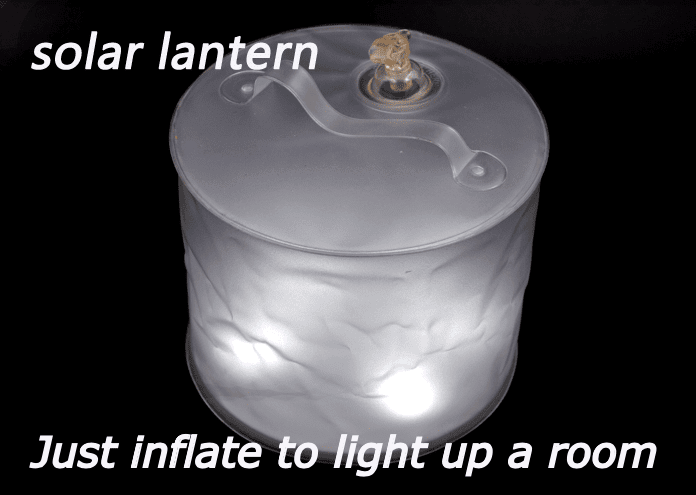
Check out this cool new survival gadget.
It’s easy to use. Just charge it in the sun. Inflate it. And light up a room.
6-12 hours of backup light from a single charge! No batteries, no wires, no hassle. And at only 1 inch tall when deflated, it stores easily in your car or survival kit.
Plus, it’s waterproof so you can use it in the water.
This Weeks Articles: |
|
|
|
|
|
|
|
|
As always we are happy to answer any questions you have about buying gold or silver. In fact, we encourage them, as it often gives us something to write about. So if you have any get in touch.
|
| Today’s Spot Prices Spot Gold |
|
| NZ $ 1750.74 / oz | US $ 1125.20 / oz |
| Spot Silver | |
| NZ $ 22.06 / oz NZ $ 709.22 / kg |
US $ 14.18 / oz US $ 455.826 / kg |
| 7 Reasons to Buy Gold & Silver via GoldSurvivalGuide Today’s Prices to Buy |
|
1oz NZ 99.99% pure gold bar
 $1810.27 |
|
1kg NZ 99.9% pure silver bar
 $801.42 (price is per kilo for orders of 1-4 kgs) $786.85 (price is per kilo only for orders of 5 kgs or more) |
 |
|
1oz PAMP Suisse 99.99% pure gold bar
 $1857.02 |
|
1kg PAMP 99.9% pure silver bar
 $830.14 |
|
1oz Canadian Gold Maple 99.99% pure gold coin
  $1882.05 |
|
1oz Canadian Silver Maple 99.99% pure silver coin (Minimum order size tube of 25 coins)
  Tube of 25 $733.25 Box of 500 $14,225 (Fully insured and delivered) |
|
|
Note:
|
| Can’t Get Enough of Gold Survival Guide? If once a week isn’t enough sign up to get daily price alerts every weekday around 9am Click here for more info |
Our Mission
|
| We look forward to hearing from you soon. Have a golden week! David (and Glenn) GoldSurvivalGuide.co.nz Ph: 0800 888 465 From outside NZ: +64 9 281 3898 email: orders@goldsurvivalguide.co.nz |
 |
 |
| The Legal stuff – Disclaimer: We are not financial advisors, accountants or lawyers. Any information we provide is not intended as investment or financial advice. It is merely information based upon our own experiences. The information we discuss is of a general nature and should merely be used as a place to start your own research and you definitely should conduct your own due diligence. You should seek professional investment or financial advice before making any decisions. |
| Copyright © 2013 Gold Survival Guide. All Rights Reserved. |
Pingback: Why Stocks Could Fall 50% if the Fed Makes the Wrong Move -
Pingback: Antifragile author Nassim Nicholas Taleb -
Pingback: Legendary Investor Says “Get Out of the Stock Market & Buy Gold” - Gold Survival Guide