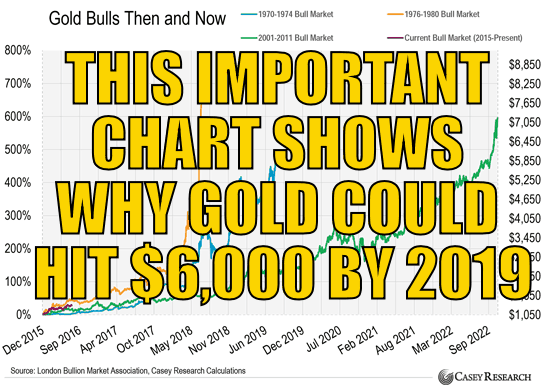
This Important Chart Shows Why Gold Could Hit $6,000 by 2019
By Justin Spittler
Editor’s note: Today, in place of our usual market commentary, we have another important essay for you from International Speculator editor Louis James. Last week, Louis explained why it’s not too late to get in on the big gold boom right now, saying “I think we’re all about to make a pile of money.” Today, he shows you just how high gold could go as this bull market gains momentum. As you’ll see, right now is the ideal time to own gold stocks…Dear Reader, “You’re crazy, buying gold now!” That’s what one of my students said to me in the summer of 2008. I was teaching one of my seminars on entrepreneurship, that time in the Republic of Georgia. Gold had risen for seven years and was trading around $800 per ounce. This student was a very bright Azeri fellow, business savvy and economically astute. But also a product of his education. He said it was foolish to buy gold, which had no real use, when it had become so expensive. I told him, and the whole class, to watch what happens to gold when everything almost everyone thinks they know about economics gets called into question. They had that opportunity a few months later, in the crash of 2008. As you may recall, gold initially took a hit. There were margin calls and fund redemptions left and right. Jobs disappeared and money vanished into thin air it’d been made of. People were forced to sell anything anyone was willing to buy. That included gold—which dropped to almost $700. My student wrote a snarky email asking me if I still thought buying gold was a good idea. I wrote back, saying that those who bought before the crash and didn’t panic would come out well before long. And I told him that buying (more) while it’s value was manifestly up and its price was down was an even better idea. I remember readers writing in to ask what was wrong. Gold was supposed to be protecting them during crisis, not falling with everything else. The best of the best gold stocks went on sale with all the dreck. I told subscribers to stay disciplined and, as Casey Research founder Doug Casey likes to say, “back up the truck for more.” In truth, gold was doing its job. People whose paper wealth evaporated but who were lucky enough or smart enough to have bought gold had a liquid asset they were able to use to cover emergency needs. Many of those who’d dismissed gold were wiped out. It was an educational reality check. As soon as the immediate liquidity crunch passed, gold made a sharp reversal upwards. It finished the year in the black, when almost everything else was drowning in the red. The best of the best gold stocks rebounded as well, then pushed on to new highs in 2009, 2010, and 2011, as gold went screaming up to $1,900 per ounce. I ran into my student at a conference in Italy in 2009. To his credit, he admitted that I was right. To their credit, many of my readers who bought with me during the crash of 2008 made spectacular profits in the following years. And they deserved to. They took what felt like a huge risk when few others had the courage. The point of this story, today, is that those who bought after the initial rebound, in 2009 and 2010, also did extremely well. Below is a table showing the ticker symbols of every stock we recommended as one type of buy or another in the December 2008 edition of the International Speculator, and their gains from then until early 2011, when gold stocks were peaking. (Note: gold stocks peaked before gold did.)
| Ticker | 12/03/08 Price | 3/2/11 or Sell Date Price | 2011 Gain |
| DGC.T | $3.67 | $12.24 | 234% |
| OSK.T | $2.07 | $10.46 | 405% |
| ADM.V | $0.74 | $1.57 | 112% |
| XAU.T/REN.V | $1.17 | $1.69 | 551% |
| BBR.V | $0.54 | $3.52 | 552% |
| CPQ.V/COR.V | $1.05 | $0.47 | 493% |
| XRC.V | $1.51 | $5.15 | 241% |
| FVI.V | $0.56 | $0.95 | 70% |
| ICI.T | $0.19 | $1.93 | 916% |
| ITH.V | $0.88 | $9.40 | 968% |
| JIN.T | $0.44 | $0.62 | 43% |
| OK.V | $0.40 | $1.00 | 150% |
| PEZ.V | $0.50 | $2.12 | 324% |
| PG.T | $1.58 | $6.82 | 332% |
| SVM.T | $1.78 | $13.53 | 660% |
| SSO.T | $10.98 | $18.20 | 166% |
| WTM.T | $0.16 | $2.22 | 1,288% |
| Average Gain | 441% | ||

 Louis James
Senior Investment Strategist
Casey Research
Editor’s note: If you’ve ever been interested in buying gold stocks, this may be the best opportunity you’ll ever get. You see, for the first time ever, Doug Casey is stepping forward and sharing the method he’s personally used to make millions of dollars in gold stocks. Doug has been perfecting this investing strategy over the last 40 years. He’s used it make gains of 487%, 711%, and even 4,329% in gold stocks. And he’s explained everything you need to know in this brand-new, FREE video presentation. By watching this video, you’ll also learn how you can gain access to the current BUY LIST…a list of the nine gold stocks poised to deliver massive returns in the months ahead. Click here to learn more.
The article This Important Chart Shows Why Gold Could Hit $6,000 by 2019 was originally published at caseyresearch.com.

