See what craziness just happened in the oil market along with whether the gold to oil ratio can tell us anything about what is going on in the global economy…
Yesterday we saw an inverse oil shock. The nearest oil futures contract plunged down to $1 before actually going negative to -$37.
The Australian Financial Review reported:
“They’re running out of space in Cushing, Oklahoma, one of the world’s biggest crude oil storage hubs — sending the benchmark West Texas Intermediate contract for May delivery below zero for the first time in history.
‘In less than half an hour of stunning trading early on Tuesday (AEST), traders crashed the May WTI to an unprecedented minus $US37.63 a barrel.”
This means oil producers (or maybe more likely speculators) are paying others to take their oil. Or at least to offload their futures contract so they don’t have to take delivery of the oil.
This short video explains how this has come about:
However the active or most traded futures contract right now is for June delivery. Things aren’t so crazy here where US WTI oil trades at US$21 a barrel. While the November futures contract trades at US$32 a barrel.
This shows there is a belief that that demand will pick up as the world slowly recovers from the lockdown.
What Caused the Negative Price of Oil?
This has come about due to the lack of demand globally during the COVID-19 lockdown. It’s also exacerbated by the price war going on between Russia and OPEC. And perhaps a war now also being waged on the US shale and fracking oil industry and perhaps even the US dollar itself?
The mainstream reporting is mainly on why the price fell and what impact on petrol prices will be. For example, the NZ Herald has: Q&A: Oil prices go negative. What does that mean?
However as we discuss below there are likely to be flow on effects much larger than simply, will the price of petrol at the pump drop?
What Will the Impact of These Record Low Oil Prices be?
We’ll call it an inverse oil shock, as the oil shock of the 1970’s was caused by a lack of oil and skyrocketing prices. This led to price freezes, car-less days and other government interventions.
Whereas this is the inverse of that. Caused by a glut of oil and no demand.
But funnily enough it’s likely to lead to similar responses by some governments. We might see price controls and governments intervening in the oil markets.
Which governments? Those that rely upon oil revenues to fund their spending. Such as Russia and Saudi Arabia.
Whereas the USA doesn’t export oil so doesn’t directly rely upon it for government revenue. However the interventions are likely to be as great or even greater there. Why?
Because while the US doesn’t export oil it is the biggest oil producer. So the US economy is going to be hit hard by these crazy low prices. There will be a flow on effect as other businesses are affected by the downturn in the oil production regions.
Related: What Will the Impacts of the COVID19 Lockdown be on the Global and New Zealand Economy?
Then there is also the impact on the junk bond markets.
Greg Canavan in The Rum Rebellion points out:
“According to Fortune magazine, the energy sector has US$86 billion in debt maturing over the next four years. Ouch.
According to the Financial Times:
‘…the business model for many exploration and production companies was broken before oil prices fell. Fuelled by cheap credit, US shale producers borrowed heavily to invest in drilling, causing the US energy bond market to triple in size over the past decade. The focus has been on producing quantity to conquer market share and the flood of oil has yielded low returns for equity investors, as frackers reinvested windfalls and raised top executive pay. US fracking pioneer Chesapeake Energy, for example, hasn’t generated a single year of positive free cash flow in the past decade. As debts rose along with oil supplies, a shakeout was inevitable.’
Energy companies are the largest issuers of junk bonds. They account for 11% of the high-yield market.
The simple fact is that easy money led to an oversupply of oil in the US. That’s why there is now such a massive difference between the US oil price (West Texas Intermediate), which is currently US$16.10 and the international oil price, represented by Brent crude, currently trading at US$25.57.”
The US central bank recently announced they would be buying junk bonds including junk bond EFT’s. Maybe they saw what was coming? But even buying junk bonds may not be enough to save many, many oil related business in the USA and around the world.
So, there are likely to be even more interventions by the Federal Reserve and US government now. They may even nationalise parts of the US oil industry. There is also the possibility of ructions in the global derivatives market.
Mike Maloney provides a good summary of possible ramifications of this unprecedented oil price plunge:
Gold to Oil Ratio
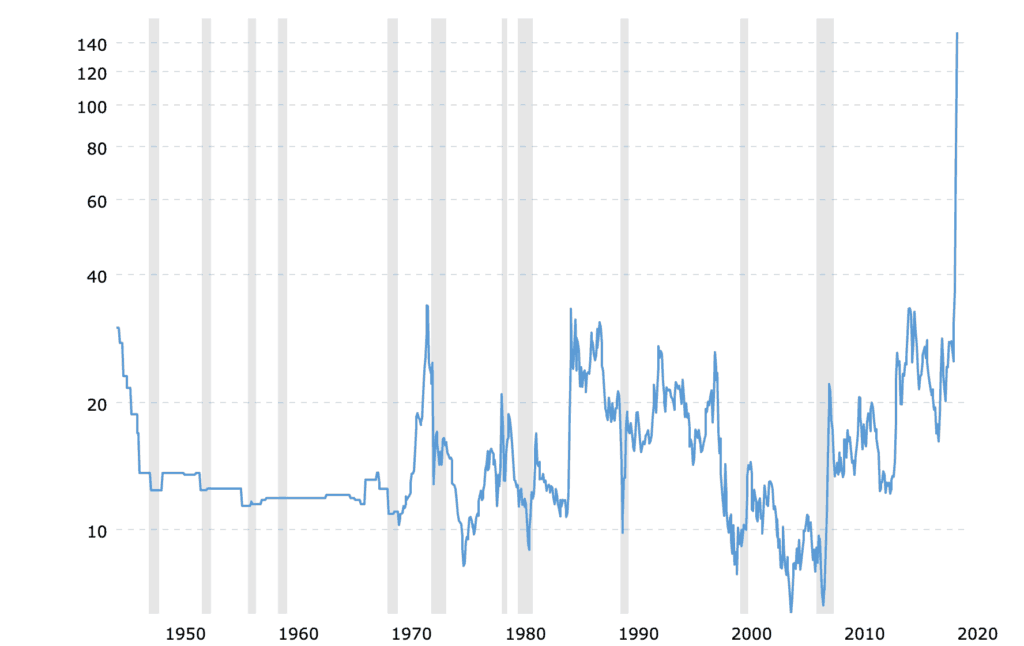
The gold to oil ratio shows us how many barrels of oil you can buy with an ounce of gold.
The gold to oil ratio just did a moonshot as the oil price dropped to zero and then below. As a result, the gold to oil ratio chart below looks pretty crazy. (Although not quite as crazy as it did yesterday while prices were negative!)
What Can the Gold to Oil Ratio Tell Us?
Probably not a lot. Gold and silver often follow each other reasonably closely. Which is why there is not a huge variation in the ratio in the past 80 years. Varying between single digits and – until now at least – about 35.
Rather we think it’s reflecting what we already know. The ratio has been rising since 2008. Meaning the gold price was going up versus the oil price. Yesterday’s sharp rise is indicating that the world is heading for at the very least a major recession. The oil price is crashing due to lack of demand.
This is showing we are in a deflationary phase currently.
This spiking ratio may be an indicator of how gold will do in a longer term deflationary bust. That is, perhaps gold will hold steady, while the prices of many other goods fall due to lack of demand?
Many people might hold the belief that gold should be spiking higher right now. But gold is doing what it should. Protecting your wealth while other assets are falling in value. And in these crazy markets, which are likely to be crazier, keeping what you’ve got is what the aim should be.
Odds are we will see more falling prices yet – i.e. a deflationary environment.
However we still think that any deflation is likely to be followed by inflation. For more on that see: NZers: Do You Hold Cash or Gold in the Coming [or Already Here?] Crisis?
Pingback: Where Will the NZ Govt Get the Money for its Dramatic Increase in Spending? Tax, Borrow or Just Print it? - Gold Survival Guide
Pingback: Negative Interests Rates in NZ by November? - Gold Survival Guide