
In our daily prices alerts we’ve been continuing to track a possible breakout in gold in NZ dollars.
Today we’ll have a look at how likely a gold breakout is, along with a look at silver in NZ dollars, and the New Zealand Dollar chart too.
Gold in New Zealand Dollars Breaking Out?
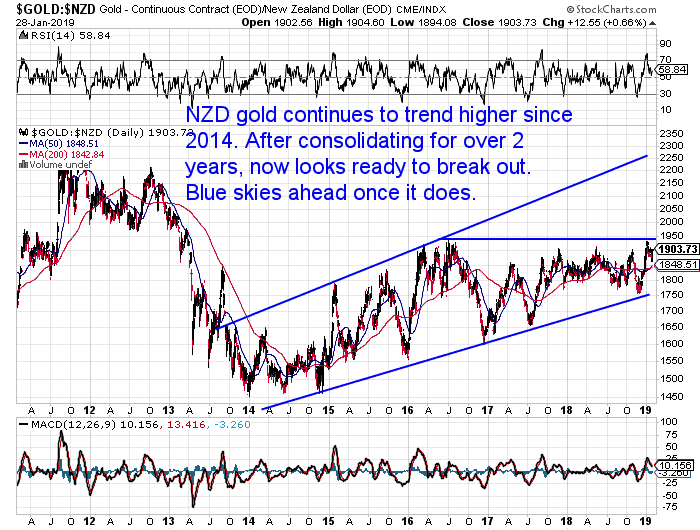
While NZD gold has been trending higher overall since 2014, it has been unable to make new highs since 2016.
But at the end of December 2018 gold in New Zealand Dollars got very close to the 2016 high.
Since then gold has pulled back a bit. But not as much as we’d have expected.
It’s a little too early to call yet, but we’re wondering if gold in NZ dollars might not be far off a break out.
Buying on a breakout can be a good move. Especially when there has been a lot of consolidation, as there has in the lead up to this one. Because the move that follows can often be hefty.
How High Might NZD Gold Go From Here?
Once we see a clear and definite breakout above the 2016 high – at around $1930 – there is a lot of “blue sky” ahead.
We could then expect to see gold push on all the way to $2200. As there is no major overhead resistance between $1930 and $2200. This is also where the uptrend line currently extends to.
Above this is the all time high of $2350, so there remains plenty of upside ahead yet for gold.
The RSI overbought/oversold indicator has now pulled back to neutral levels near 50. But the pullback in price has been fairly minimal. So we are tending to think another test of the $1930 zone is probably not far away.
NZD Silver Also Close to a Break Out
Silver in New Zealand dollars is also close to a break out.
Having shot higher back in 2016, NZD silver has since been in a downtrend. Making lower highs for the past 2.5 years.
But NZD silver is also in a large multi-year wedge formation. Meaning the silver price has been bouncing between an overhead downtrend line and a rising trendline (blue lines in the chart below).
Silver has faked a breakout from this pattern on more than one occasion (see back in mid 2018 for the most recent). But before too long it will have to break out of it.
This wedge formation means silver is building like a giant coiled spring. So when this breakout happens it will likely be quite significant.
But in the meantime most people are probably losing patience with silver.

When Will the Silver Breakout Happen?
Well it could be close to happening in NZ Dollar terms. After rising strongly from below $21 in late 2018, silver pulled back for the first few weeks of 2019.
This pullback has seen silver also move out of overbought territory on the RSI indicator. NZD silver is also sitting above the 200 day moving average line.
So the technical indicators are looking promising.
Of course, we could see silver move back down yet again, as it has done on previous occasions after touching the downtrend line. There is still room left within the wedge for another pull back to the $21 region.
However, this wedge formation can only carry on for so long. If we see a definite gold breakout, then silver will likely follow.
Related: Should I Buy Gold or Silver? 7 Factors to Consider in Gold vs Silver
A Weakening New Zealand Dollar Could Aid a Gold and Silver Breakout
The New Zealand dollar fell sharply throughout most of 2018. But made a comeback in the last quarter.
Interestingly the Kiwi dollar is also in a giant multi year wedge formation. However, unlike gold and silver, the Kiwi has not touched the overhead downtrend line recently (not since April 2018).
There is data to support the NZ dollar weakening further in the long term.
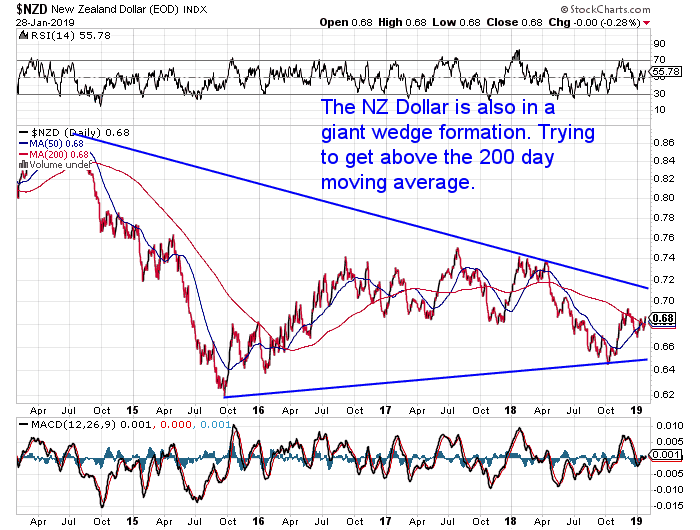
If the Kiwi weakens in the long run this will be supportive of NZD gold and silver prices. A further fall in the Kiwi could also aid in the breakout of gold and silver.
But we wonder if it may just continue to trend sideways for a while now. Meaning it will be the US Dollar gold and silver prices that have the most impact on the local precious metals prices.
(If you’re unsure about any of the terminology we use in analysing these charts, check out this article: Gold and Silver Technical Analysis: The Ultimate Beginners Guide.)
Should You Buy Gold Now or Wait and See if a Break Out Happens?
If you can’t decide what to do, then maybe you should read this:
Should I Buy Gold Today or Wait?
Editors Note: This article was first published 15 May 2018. Updated 29 January 2019 with new charts and commentary.