
Last week we wondered if NZ Dollar silver might have broken out of the multi-year consolidation pattern it had been in:
“With the price today getting clearly above the downtrend line in this wedge or pennant formation. A clear break about the horizontal resistance line around $45 will confirm the next leg up in silver has finally begun.”
Source.
With the passage of just another 6 days we reckon we can now say, yes it has!
Table of contents
Estimated reading time: 6 minutes
Silver in New Zealand dollars has moved sharply higher over the past couple of weeks.
Looking at the 5 year chart below, we can see silver has clearly broken above the downtrend line that has been touched multiple times since the high of 2020.
In early 2023 silver broke above then down trend line. But that proved to be a fakeout. As silver then went sideways and bumped up against a new downtrend line 3 times during the rest of 2023.
But now we can see it has clearly broken higher above the downtrend line at NZ$42.
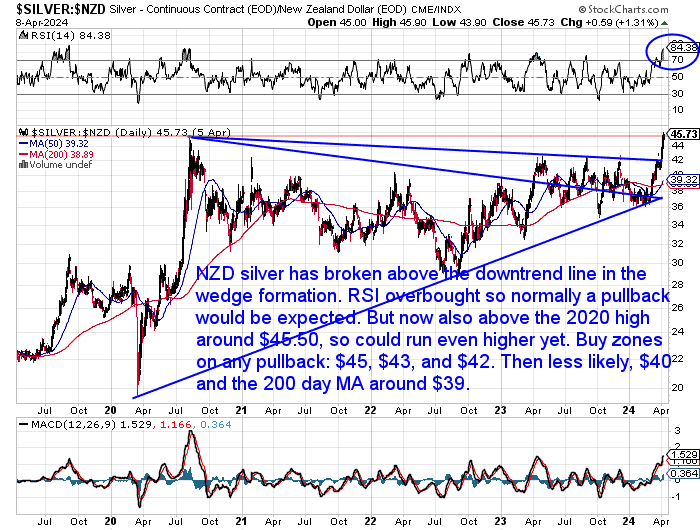
So this chart would seem to indicate that silver has broken out and will now head higher.
Or does it?
Silver Breakout or Fakeout?
We’ve seen a number of “head fakes” from silver in the past years:
- In April 2017 silver touched $27.00 before taking a dive all the way down to the low $20’s…
- NZD silver moved higher in late 2017. Briefly nudging up to $25.50 before falling back sharply….
- Then in June 2018 silver once again “head faked” a move higher. Touching $25.00 before again returning to the low $20’s…
- And as noted above already, at the start of 2023 silver again faked a breakout, before then consolidating sideways for another 12 months…
So is this just another silver fake out?
Is the Silver Breakout For Real This Time?
In 2022 we saw the silver price repeatedly touch the downtrend line that extends back to 2020.
Then during 2023, silver also repeatedly bumped up against the new downtrend lone.
But now, as noted above, silver has pushed sharply higher and is clearly above the downtrend line.
What’s Different About This Current Rise in Silver?
- Silver in NZD is also now above the $45.50 level. A price it hasn’t bettered since 2020.
- The price of silver has also made a higher high for the first time this year.
- USD silver has also broken out of the same pattern (see lower half of the chart below). So unlike the previous fake-out moves listed above, silver is now rising in the US currency also. Whereas the moves in the previous years were mostly driven by the weakening Kiwi dollar.
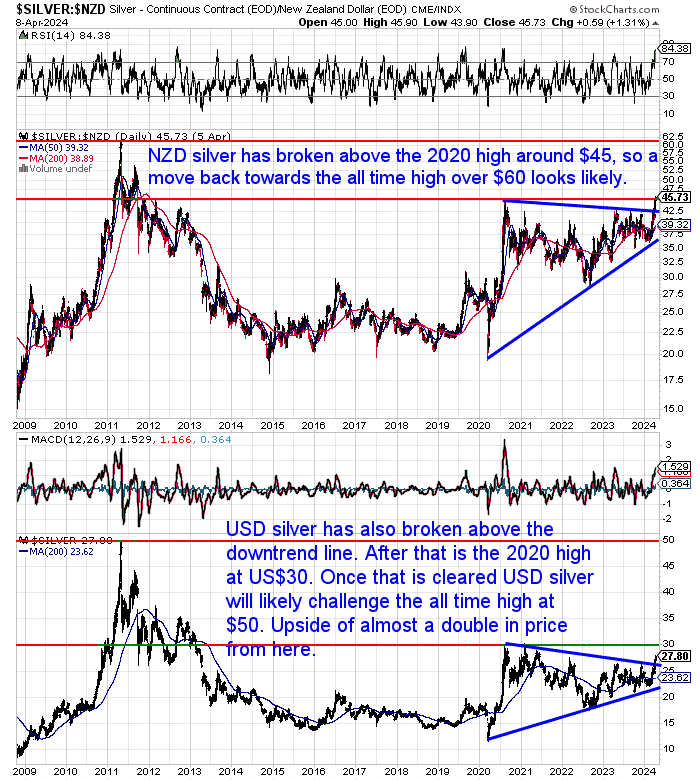
Silver From Consolidation to New Bull Market
The long term chart above shows that silver in NZ dollars bottomed out back in late 2014. It made a sharp run higher in 2020, reaching a high of $45. But since then it has been in a downtrend for the past three and half years.
This looks to have now changed. The uptrend or bull market may be re-emerging. It is now likely we see silver challenge the all time highs of NZ$62.50 and US$50 in the coming months. The final hurdle is to see the USD price clear the 2020 high of $30 (see the green red support/resistance line in the chart above).
After the Breakout – Where to From Here For Silver?
In New Zealand Dollar terms we have now seen the key level of $45 breached. As this was the high reached in 2020, after the big run higher when the Covid-19 currency printing was at full noise. But it is also the 61.8% Fibonacci retracement level. Bettering this level has also formed a higher high in the move up since the 2014 bottom. Opening up for a move towards the all time high above $60.
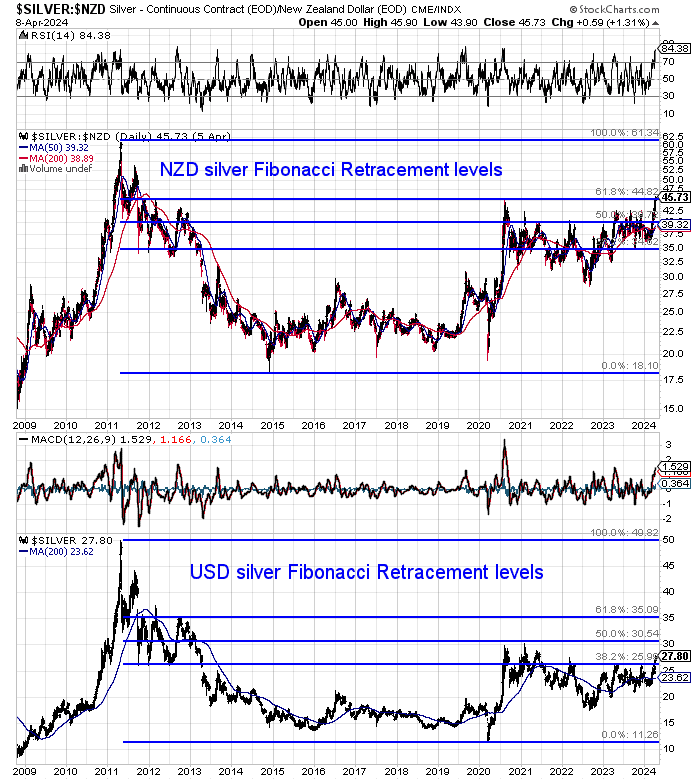
In US dollar terms the next overhead resistance level is not far above current levels, at the 2020 high of $30. This is also the 50% Fibonacci level. If $30 was broken, then the 61.80% Fibonacci level is next at around $35. Then the 100% level at US$50. These targets are shown by the blue Fibonacci retracement lines. We can expect these overhead resistance levels to be more difficult to overcome. But once $30 is broken they look likely to be challenged.
Learn about Fibonacci lines and other technical trading indicators here: Gold and Silver Technical Analysis: The Ultimate Beginners Guide Updated
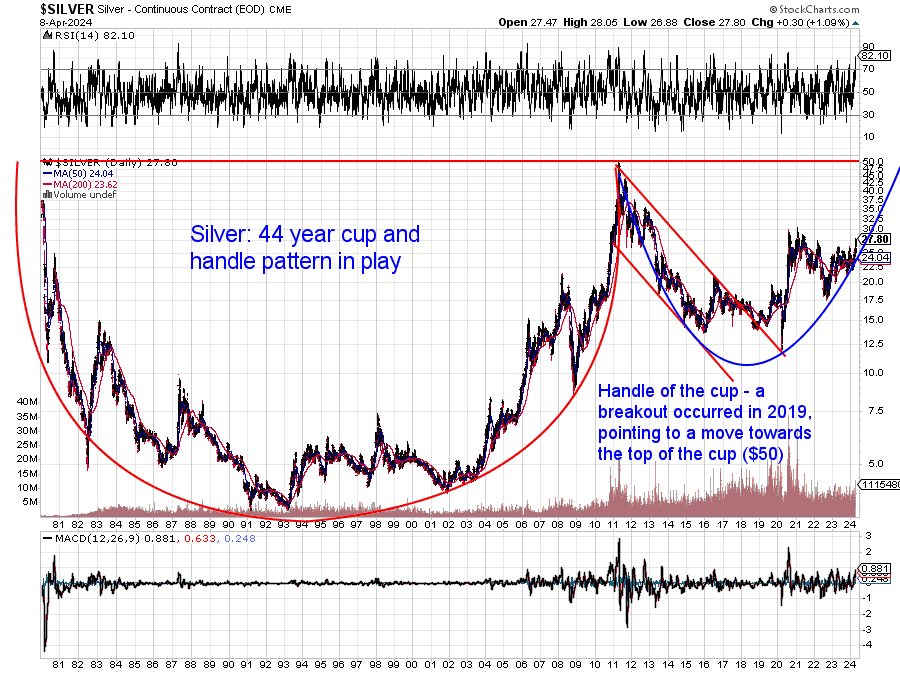
100% Upside in Silver From Here to the All Time USD High
Silver also looks to be forming a multi-decade “cup and handle” formation. Having broken above the 2 red channel lines of the handle back in 2019, the rest of the handle could be expected to form. Thereby taking silver back up to US$50. An almost 100% upside move.
Such a massive long term pattern shows silver has been building a base of support for over two generations. So a bull market lasting many years could be just beginning. Once the all time high at $50 is broken, there would be a price target of twice the move from the early 1990’s low. This would take silver up near to $100.
Could Silver Have Even More Upside than US$50 or US$100?
The US dollar silver high of $50 in 2011, only matched the 1980 all time high.
Even though today there are vastly more dollars in circulation than in 1980.
The interesting chart below from Hubert Moolman shows the silver price relative to the US monetary base (in billions of dollars).
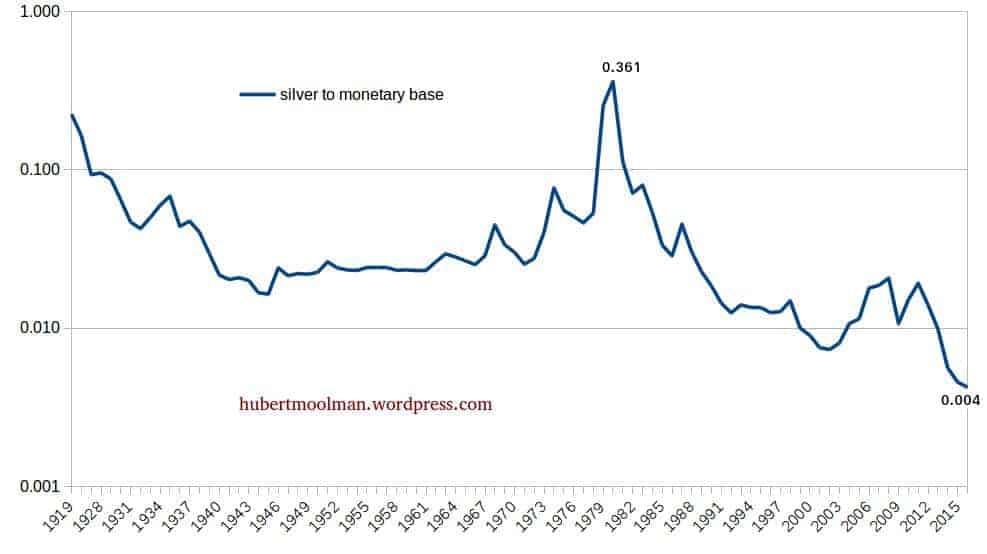
Moolman notes:
“In 1980, the all-time high was 0.361, whereas the ratio is currently at around 0.004. The US monetary base is currently around 3 304 billion dollars (or 3.304 trillion). Therefore, if silver was today at its 1980 value, relative to the monetary base, it would be around $1,193 (3304*0.361).
So, in terms of US dollars in existence, silver is trading at 1.24% (14.84/1193) of its 1980 high – it is the bargain of the century.”
Source.
Silver to Monetary Base Update for 2024:
The above numbers were as of June 2019. Today the US silver price is higher at $27.87, but so is the US monetary base. Despite pulling back through 2022, after the huge currency printing during Covid-19, the US monetary base still sits at $5,896 billion (5.896 trillion). So at 0.0047 ($27.87 / $5896), the silver price relative to US monetary base ratio is not that much above what it was in 2019 (0.004).
But if silver was today at its 1980 value relative to the US monetary base, silver would need be around US$2,100 per oz! (5896 x 0.361).
Now, we’d have to admit that a silver price of $2,100 seems pretty out there. But in the 1970’s precious metals bull market, the price went up by something like 50 times. A rise from $27.87 to $2,128 would be an increase of around 75 times. Definitely more than the 1970’s but it doesn’t sound quite so nuts when compared in that way.
But even if these seemingly crazy numbers don’t come into play, just reaching the old highs offers a 100% upside. We can’t think of any other financial assets or commodities that are still to better their 1980 high. That nows seems like a case of when, rather than if.
Making it an excellent time to buy silver.
Editors note: Originally posted 24 July 2019. Last updated 9 April 2024 with all new charts and prices and commentary.
Pingback: Silver is the Star this Week - Gold Survival Guide
Pingback: RBNZ Slashes OCR - The Race to the Bottom is Speeding Up and NZ Won’t Be Left Behind! - Gold Survival Guide
Pingback: Central Bank Record Gold Buying Continues - Gold Survival Guide