Big Moves Higher Continue for Precious Metals
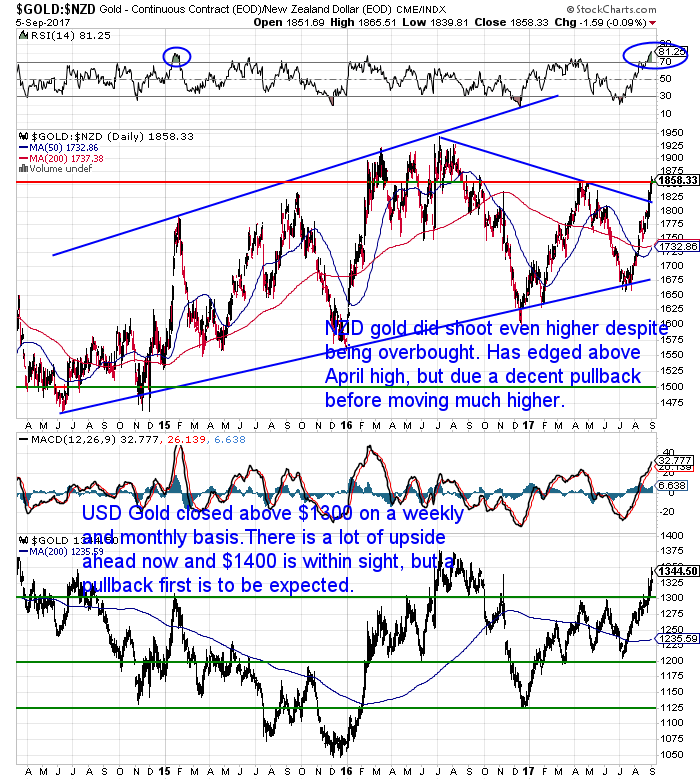
Gold in NZ Dollars despite already being very overbought headed even higher this week.
We alluded to this last week. The fact that in early 2015 gold was overbought but then proceeded to get even more overbought and move higher still.
Well, NZD gold is now above $1850 and the highs of April. But the RSI indicator (blue circle in chart below) is now above 80 and so extremely overbought. So a decent sized correction now looms. That will be the chance to take a decent sized position in gold and then sit tight.
Because this week there has been a few significant moves in gold that will now likely attract more money into the forgotten sector of precious metals. More on that to come.
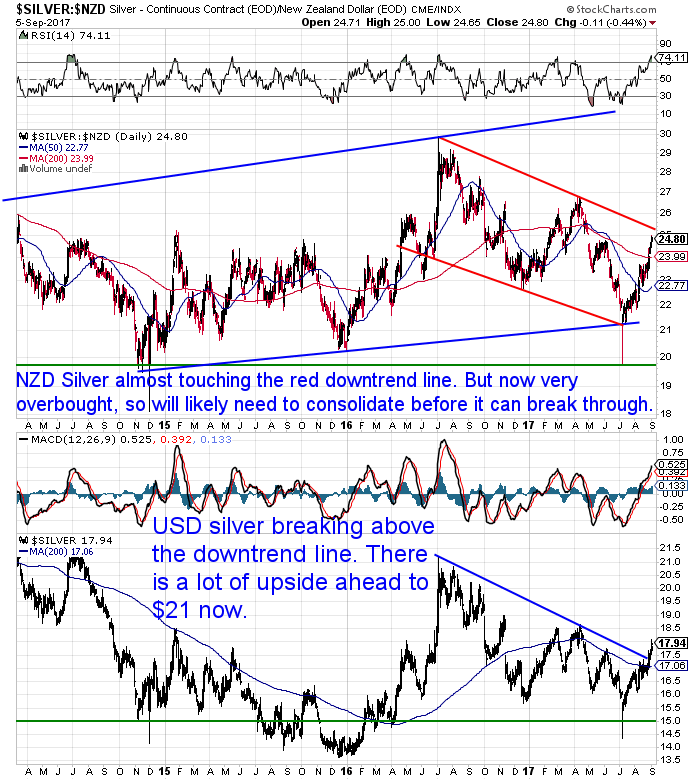
NZD silver did not disappoint this week though either – up over 3%.
Silver has now almost reached the red downtrend line. But like gold it too will likely need to consolidate before it will manage to breach this line.
Buying zones to look for will be $24, $22.77 and if you get the opportunity the uptrend line at $21.50.
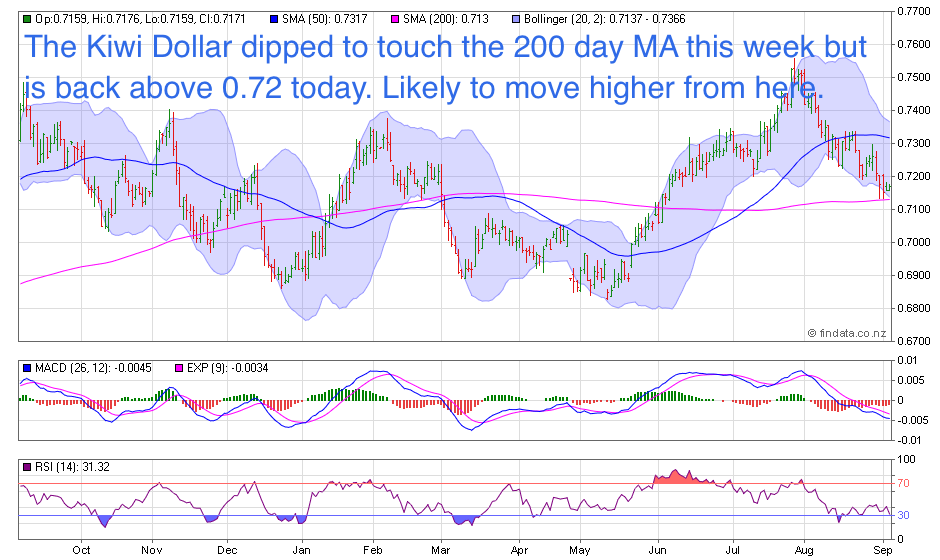
Another reason to expect a pullback in both NZD gold and silver from here is the Kiwi Dollar. It moved lower to touch the 200 day moving average (MA) at 0.7130 this week but has bounced higher.
The NZ Dollar will likely move higher from here, which will also put downwards pressure on local precious metals prices.
Gold Breaks Out of 6 Year Downtrend
Now back to the significant events of the past week for gold.
But there are times when it’s useful to check out the globally followed US Dollar price of gold. As this is what the big money takes notice of.
Last week gold broke decisively above the horizontal resistance line at US$1300. It had been turned back from the $1300 line multiple times this week.
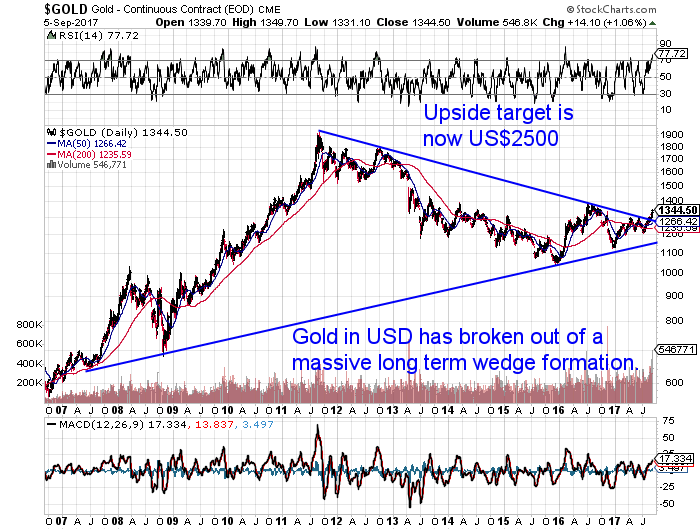
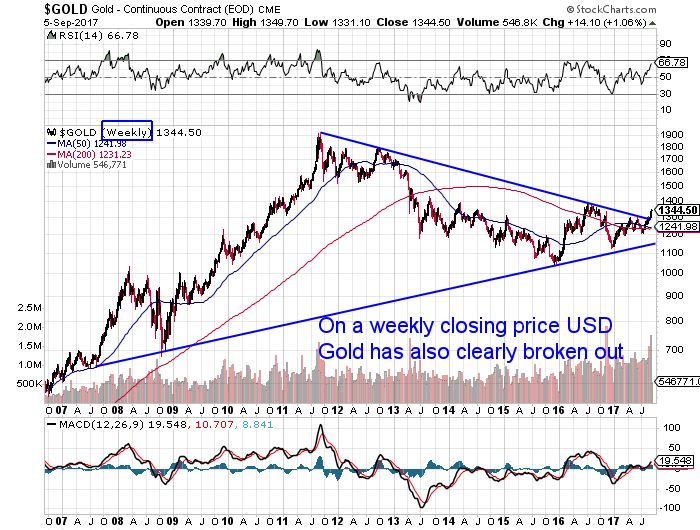
Now this week gold has broken out of a massive long term wedge formation stretching back to 2011 and 2008.
USD gold has been in the ever narrowing wedge since the high of 2011 at US$1900. But this week it has broken conclusively above this downtrend line. So now there is a lot of upside ahead.
How much upside is possible now?
Well the next serious resistance line is US$1400 and the odds are it won’t take too long to reach that as it’s only around US$50 away. There is a lot of blue sky ahead after that on the way to the high of US$1900.
But with these wedge breakouts there is another way to determine a rough price target. Analyst Ben Morris notes:
“A “wedge” is a chart pattern in which the asset’s support is a rising trend line and its resistance is a falling trend line. The asset bounces around within a smaller and smaller range. And when it breaks out, it often does so in a big way.
It’s like letting go of a compressed spring. And the bigger the wedge, the more the asset is likely to move.
…when an asset breaks out of a wedge – either to the upside or to the downside – you can figure out a rough price target based on the breakout point. And in this case, it suggests gold could be headed much higher…
To keep things simple, let’s say the first point on the bottom of gold’s wedge was $700 per ounce (it was right around there in 2007). The first point at the top of the wedge is $1,900 per ounce. That’s a $1,200 range.
You can use $1,200 from the breakout point as a price target. Since gold broke out of its wedge at about $1,300 per ounce, the chart pattern suggests a price target of $2,500 per ounce.
That’s an extremely optimistic price target… But it is possible.”
Also of note is that the USD gold price has also broken out of this same wedge pattern in charts displaying the price on a weekly closing price…
And also a monthly closing price…
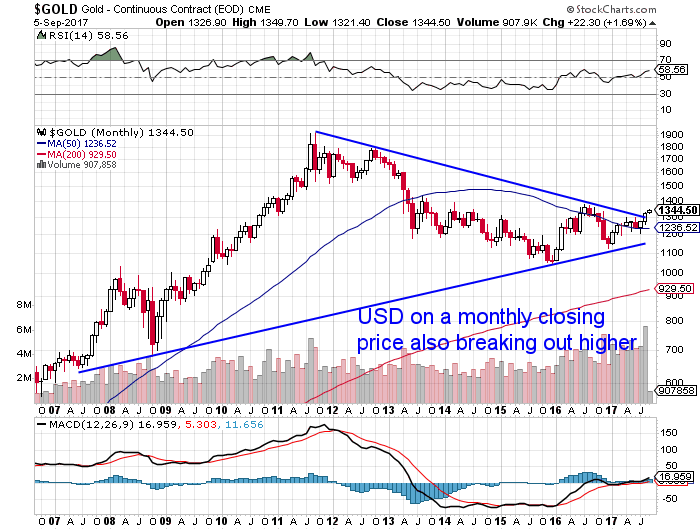
Weekly and monthly charts simply depict the price at the end of each week or month (as opposed to our usual charts which have the daily closing price).
These are good indicators of a serious change in trend to a bull market.
Gold is likely to attract big money institutional buying now that these key levels have been broken. These buyers are likely to use the gold ETF’s like GLD. Historically money moving into these has moved the paper price of gold higher, much more so than any pick up retail demand has.
So then a rising price is likely to attract more buyers.
Hence why the upside target mentioned above is not at all unrealistic.
Continues below
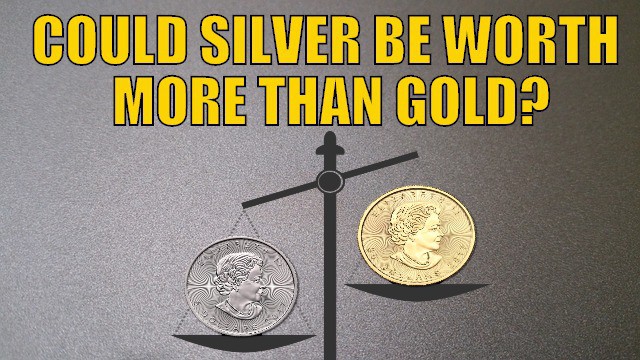
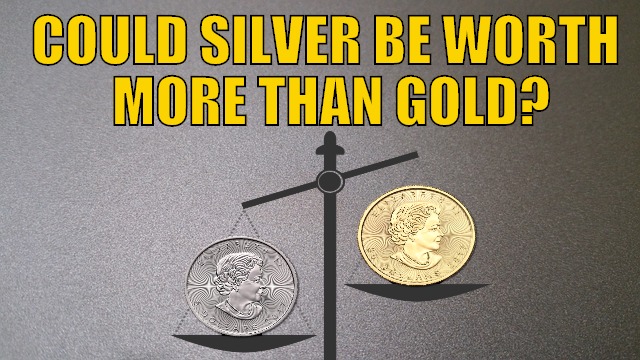
Could Silver Be Worth More Than Gold?
Our feature article this week comes by way of a reader question from Jenna. Who is also the winner of our monthly silver coin award. A 1oz coin will be winging it’s way to you soon Jenna!
So don’t forget to
get your question in to be in the running. We’re slowly working our way through them.
Jenna’s question was:
“I’ve heard a lot about how useful silver is and the many different purposes it is used for, whereas gold is mainly just precious. Will the usefulness of silver ever cause it to become a more desirable asset (ie: more valuable) than gold?”
So we’ve done a bit of research and this article covers this topic in depth including:
- The gold silver ratio over 3 centuries
- Some historical evidence of silver being worth more than gold
- Silver industrial demand versus investment demand
- Could Silver Be Worth More Than Gold Due to:
- Peak Silver?
- Increasing Institutional Investment Demand?
- Increasing Photovoltaic Demand?
Apologies
We had a problem with the system that adds our website posts to the newsletter last week. Even the second and what we thought corrected email didn’t contain them. Sorry about that!
Excellent Buying Zones Coming Up in the Next Few Weeks
If you’re thinking about buying then sign up for our daily price alert as that will help you identify the likely highest reward times to buy gold or silver in the coming weeks.
Learn more about that here.Or call David on 0800 888 465 for a quote or with any questions.
- Email: orders@goldsurvivalguide.co.nz
- Phone: 0800 888 GOLD ( 0800 888 465 ) (or +64 9 2813898)
- or Online order form with indicative pricing


