
A very bullish Stewart Thomson discusses the impacts of Indian demand, a looming US government debt crisis, and how inflation is set to surprise to the upside. And how these factors are all combining to boost gold and silver higher currently and into the future too… Debt Endgame And Gold Bull Era Graceland Updates By […]
Tag Archives: gold price charts
07
Feb
Feb
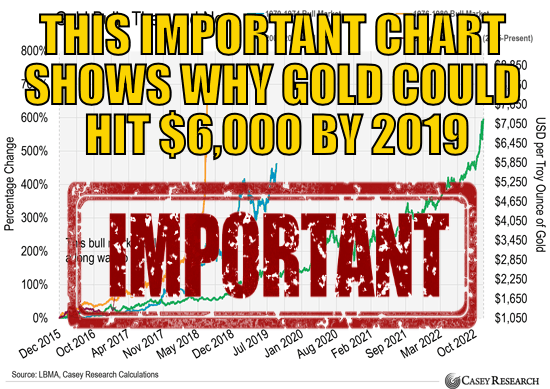
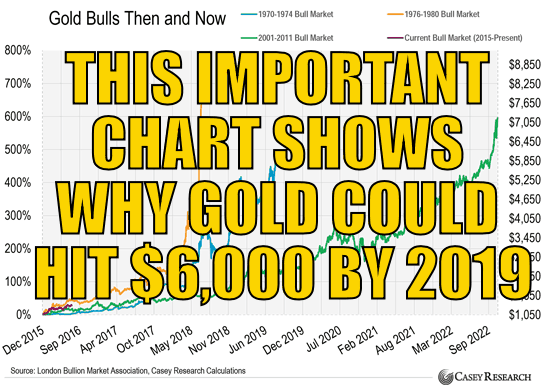
Gold might be up overall quite a margin since the early 2000’s. However it’s important to get some perspective from previous moves higher to see where gold could head to yet… Weekend Edition: This Important Chart Shows Why Gold Could Hit $6,000 by 2019 By Justin Spittler Editor’s note: Today, we have another important essay […]
02
Nov
Nov
Gold mining stocks (or shares as we call them here in New Zealand) have made some big gains this year. But their recent correction looks to have scared many people off. However there are a number of reasons to believe that we are likely still in the early stages of an ongoing up cycle in […]

26
Oct
Oct
See why Stewart Thomson thinks regardless of whether Clinton or Trump wins the US election, the outcome will be a positive one for gold… Graceland Updates By Stewart Thomson The US election is now only about two weeks away. The winner of this election is likely to be… gold. Here’s why: Both candidates are eager […]

14
Sep
Sep
There is an argument to be made that technical analysis is pointless in these times, where even the most important financial indicator, the “cost” of money (a.k.a. the interest rate) is manipulated. We are sympathetic to this view. However there are still large volumes of money that are invested by following trends. So there is […]
11
Aug
Aug
Check out this historical evidence that shows not only how much higher gold could go, but just as importantly how low it could fall and still not really matter in the long run… This Important Chart Shows Why Gold Could Hit $6,000 by 2019 By Justin Spittler Editor’s note: Today, in place of our usual […]
12
Jan
Jan
With another year gone it’s time for our annual year in review, looking at how gold and silver in NZ Dollars performed during the calendar year. Also a chance to look at our predictions (or what we prefer to call guesses!) from last year and see how we did. We do this every year – even […]

19
Nov
Nov
Overnight Tuesday, gold in US dollars closed below the July low of $1080. It dipped to a low of $1065.60 by late morning New York time before closing higher on $1069.30 for a daily decline of around $15 per ounce. You can see in the chart below this is a clear break below the July lows. […]
27
Aug
Aug
Given the big moves down in global sharemarkets and corresponding moves up in gold in recent days we thought it timely to take a look at a number of gold and silver charts. To see where we are, where we’ve been, and maybe even to have a stab at where we might be going! (Stab […]

23
Jul
Jul
As we noted in another article this week gold has fallen further over the past week and is now at 5 years low in US dollar terms. As can be seen in the chart below: Gold Could Fall Further Yet in US Dollar Terms We wrote right back in 2011 that gold could well fall […]