There is an argument to be made that technical analysis is pointless in these times, where even the most important financial indicator, the “cost” of money (a.k.a. the interest rate) is manipulated. We are sympathetic to this view.
However there are still large volumes of money that are invested by following trends. So there is still some benefit to be had by also paying attention to technical indicators that many investors and traders follow.
The following article gives an excellent run down of a number of important technical indicators for gold today. It also does a good job of summarising just where we are at in the crazy world at the moment. As well as taking into account the possibility of an inflationary or deflationary outcome.
It is well worth digesting if you are thinking of taking a position in physical gold currently…
(If you’re interested in silver here is the corresponding silver update article.)
Gold Market Update: “Going Off the Rails”
Originally published September 5th, 2016 in the Various Reports Sector at clivemaund.com
Many people are aware that the world is going to Hell, and are feeling very uneasy because they can’t see through the smog of propaganda to precisely why this is happening – after all, with progress and technological advances, life is supposed to get better for more people, right?
There are two big reasons that things are going off the rails. One is the abandonment of honest money with the world being set on the road to ruin when Nixon finally finished off the gold standard in 1971. This would not have mattered much if the dollar was one local currency, but it’s not, it’s the global reserve currency, and the financial mess and mayhem that you see all around you today is the direct and inevitable result of this, with runaway debts, astronomic derivative positions, and interest rates clamped at zero in a desperate attempt to delay it all unraveling. Those of you who are familiar with catastrophe theory will readily understand that the global economy is perched on a bifurcation cusp, between a deflationary implosion on one side, which will happen if they lose control of interest rates, and a slide into a hyperinflationary firestorm on the other. Once pushed off the cusp it’s one or other, there is no other alternative, and the latter looks the more likely outcome at this juncture because it will take longer than the former.
The other big reason that the world is going is going off the rails is that the Military – Industrial complex has seized control of the United States, and is its effective government, foreseen as a grave danger way back in 1961 by Dwight D Eisenhower. In its relentless drive for ever more power and profit it is bleeding the blood and treasure of the citizens of the United States and beyond its shores the entire world, thanks to the dollar being the global reserve currency, and has promulgated a series of wars around the world and especially in the Mid-East and North Africa, in order to justify its ever increasing budget, and in pursuit of the Neocon’s dream of world domination. Right now, with the connivance of the weak and corrupt European powers, it is working on fomenting conflict between Europe and Russia, which is why we have seen Europe impose sanctions on Russia, and in response to a relentless barrage of anti-Russian propaganda, countries in eastern Europe are buying military hardware from US arms manufacturers and stationing missile batteries along their borders with Russia, and staging provocative military exercises.
Europe has a rich tradition of destructive wars, and now that most of those involved in the last big one have died of old age, there are a lot of naïve younger leaders who seem to want to get another one started. Larry Edelson of Weiss Research has highlighted the time that the convergent war cycles reach their peak, which is 2019 – 2020, so if you live in Eastern Europe you’ve got about 3 years to get out maximum, and depending on how bad it gets, that might extend to all of Europe. The smart people in Germany, who saw the writing on the wall in the 1930’s, including Jews and some young Germans, got out while they had the chance. Many of those who didn’t ended up being killed, as we know. The writing is on the wall now, with Europe already being destabilized by hordes of refugees fleeing the devastation caused by the US Military – Industrial complex in the Mid-East and North Africa, some of whom are terrorists, and Europe is setting about provoking Russia with sanctions and militarily escalation on its eastern borders. The prudent decision of Britain to leave the European Union will also hasten Europe’s disintegration, and Europe’s economy is already on the rocks with mass unemployment and its banks failing, a perfect breeding ground for Right Wing extremism. With its complicity in smashing up the Mid-East, Europe has sown the wind, and it will surely reap the whirlwind, and the first breezes are already blowing with the arrival of millions of refugees. Their rate of reproduction is far greater than that of native Europeans, and it has already been calculated that some large countries in Europe will become Muslim by 2050. A day of reckoning is approaching for the US too, which faces eventual economic collapse, Martial Law and the emergence of a ruthless dictatorship that will no longer need to hide behind a façade of democracy.
If you think that what is written here is paranoid or far-fetched, then you have probably already sucked up too much propaganda. What is written here is factual, and a lot more reasonable than the demonization of Russia widespread in the mainstream media. As Hitler said “The bigger the lie, the more people will believe it”. Remember the old “weapons of mass destruction” yarn that was spun as a cover for the invasion of Iraq?
The reason for setting out the above is that you need to understand what is really going on if you are to comprehend what is driving the still fledgling bullmarket in gold and silver. The global financial system in on the verge of flying apart and this is synchronizing with the spread of war and chaos, although keep in mind that this is a process that will probably take several years to play out – it won’t happen next week. Even if the deflationary scenario prevails, instead of hyperinflation, it will not stop gold and silver rising in value, certainly in real terms, just as it didn’t in the deflation of the early 30’s when gold stocks soared. In the 1930’s, in an act of naked piracy, the US government, in violation of the Constitution, forcibly stole the gold belonging to its citizens, and there is of course nothing to stop them resorting to this ploy again, but you shouldn’t let this put you off owning physical metal. There are ways to circumvent government theft by storing gold in trusted overseas depositories that are out of their reach. The gold stolen by the government in the 30’s was stashed at Fort Knox, and the reason that it not been audited for many decades is probably that high ranking officials have helped themselves to it and cleaned the place out.
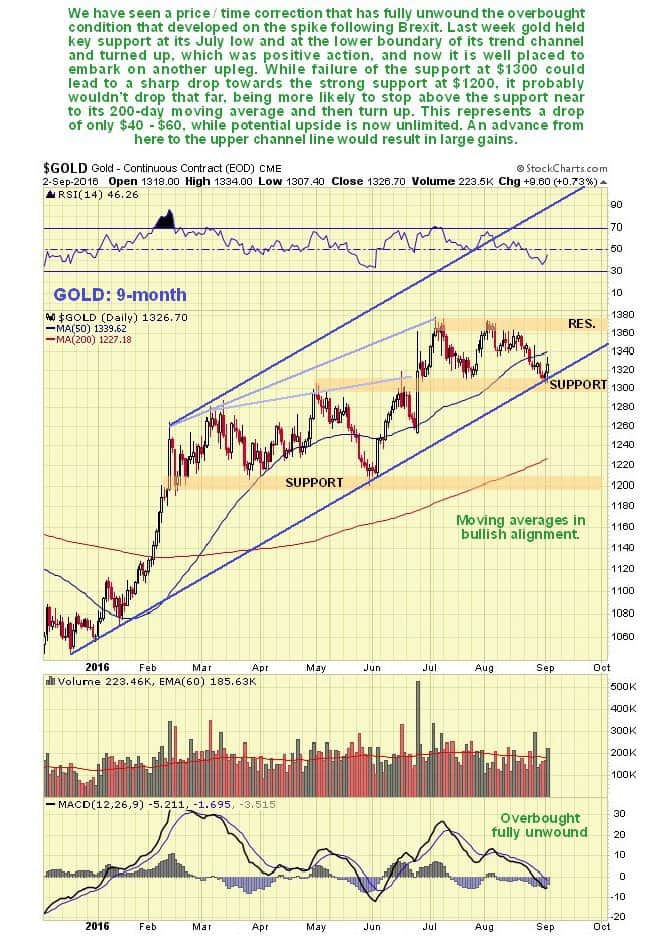
Turning now to gold itself, we see on its 9-month chart that a fine steady uptrend is unfolding with the advance punctuated by relatively modest and proportionate price / time corrections. There are signs that one such correction is completing now, and if so then we are again at a good time to buy, which is especially true with some gold and silver stocks that have corrected hard in recent weeks. While there is room for it to correct further, it won’t if the uptrend is accelerating, which is suggesting by the increasing rate of climb of the 200-day moving averages. Moving averages are in strongly bullish alignment.
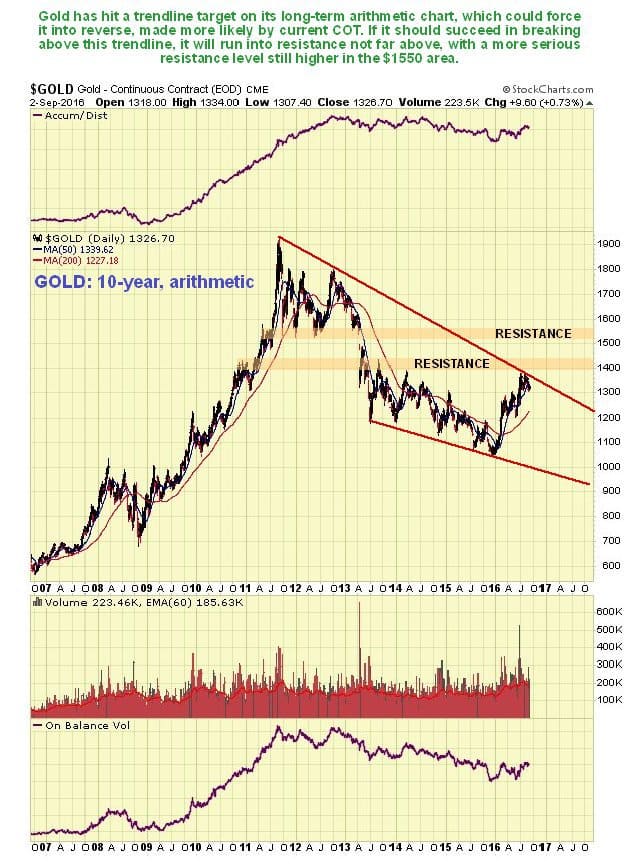
On gold’s 10-year arithmetic chart we can see why it has stalled out in recent months – it has only risen by about $40 from its March high – it is at trendline resistance, although this line is not considered to have great significance as it is projected from two peaks way back in 2011 and 2012. There is some resistance above this line in the $1400 – $1430 zone, but much heavier resistance comes into play in the $1520 – $1560 area.
The gold optix, (optimism) readings have eased significantly from high levels that made further gains difficult. The current readings at about 50% make renewed advance much more possible.
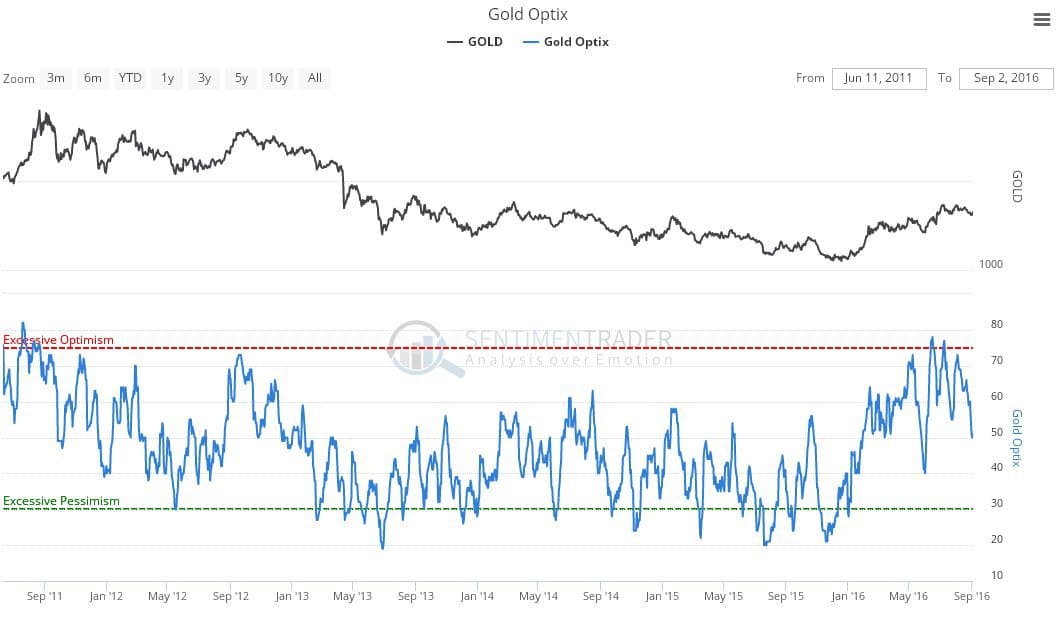
Chart courtesy of www.sentimentrader.com
COTs and Hedgers positions continue to run at a high level and be a cause for concern, although they have eased a little in recent weeks.
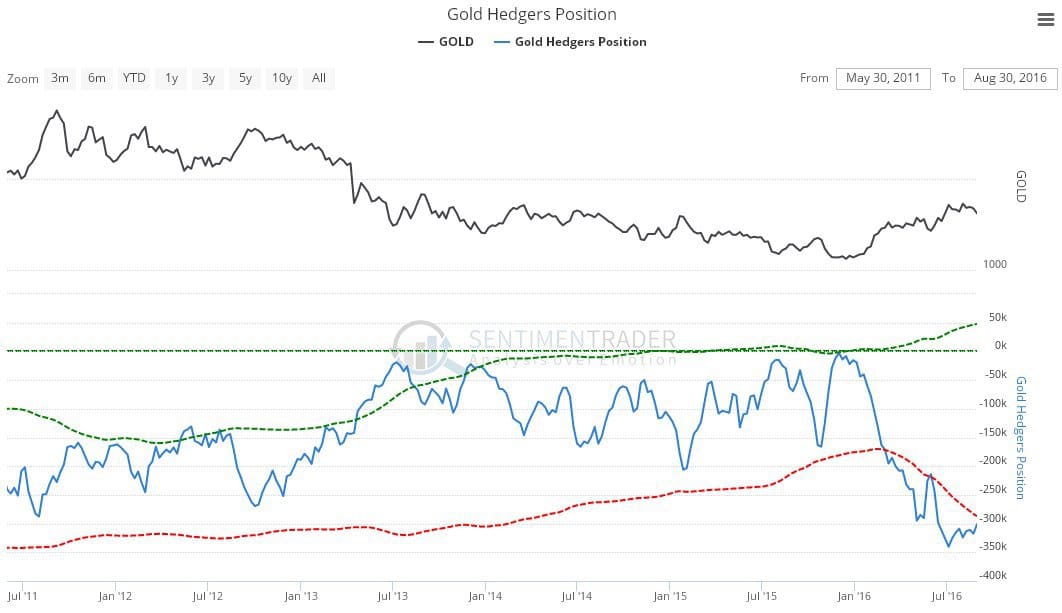
Chart courtesy of www.sentimentrader.com
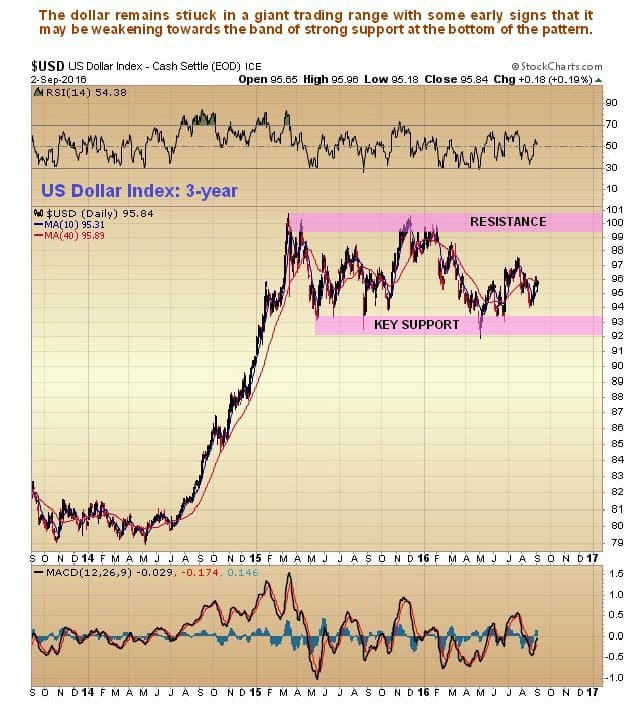
As for the dollar, there are some signs that the dollar index may be weakening towards the strong support at the bottom of the big trading range that has been building for 18 months, due partly to the latest jobs report damping down the possibility of a rate rise this month. What is remarkable about the big dollar rally of 2014 – 2015 is that it was achieved largely by talk alone, and so far there has been no blowback. If it does eventually break down from this range, it would clearly be a positive for gold and other commodities.
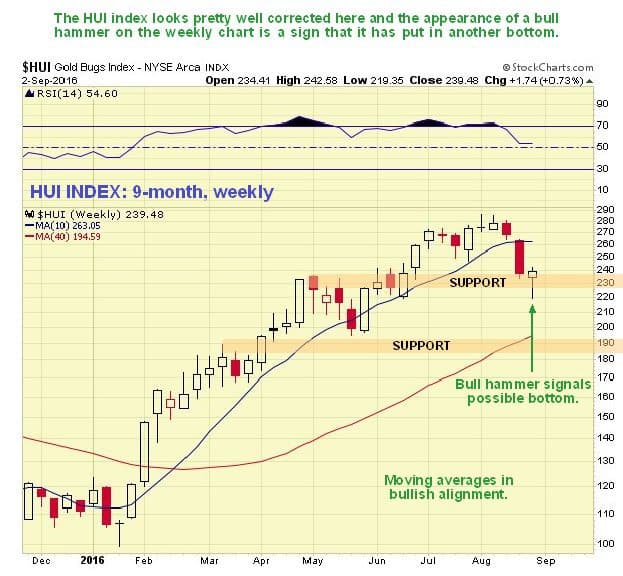
The year-to-date weekly chart for the HUI index shows that a potential reversal hammer appeared last week, and it looks like stocks have just hit bottom – and so many investors who missed the big uptrend from last January are waiting for a sizeable correction so that they can climb aboard, that it probably won’t happen, so it is considered prudent to go for better PM stocks now, accepting that there might be some further short-term downside. In many cases prices are much better than a month or two ago.
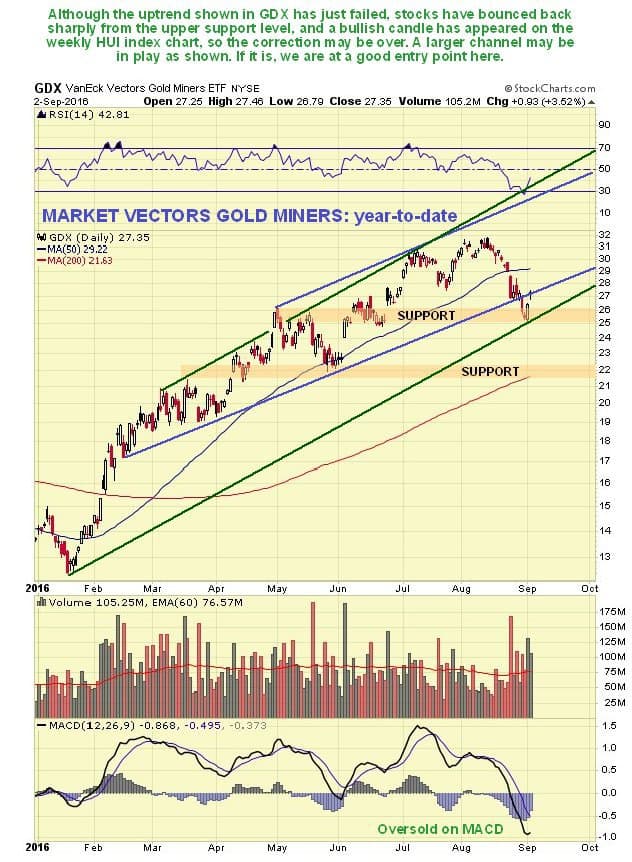
While GDX did break down from its channel that we had earlier delineated last week, this is not regarded as a serious development, because there is important support beneath this trendline, which has turned it up again, and also because the overall tenor of this chart is strongly bullish with steadily rising moving averages in bullish alignment, so it could be that the larger channel shown in green is now in play – if so we are at a good entry point here for stocks.
About the Author:
Clive Maund is a specialist of technical analysis. His website, www.clivemaund.com, is dedicated to serious investors and traders in the precious metals and energy sectors. It offers no nonsense, premium analysis to subscribers. It is 100% subscriber supported, and takes no advertising or incentives from the companies it covers. No responsibility can be accepted for losses that may result as a consequence of trading on the basis of this analysis. Happy trading.
- The Gold Standard: Generator and Protector of Jobs - April 9, 2025
- If Gold and Silver Are Manipulated, Why Bother Investing? - August 17, 2021
- Gold and Silver, Up Down, Sideways and UP - September 16, 2020