This Week:
Estimated reading time: 6 minutes
Note: Sorry we missed last week’s Wrap due to illness. So all changes in prices are referring to 2 weeks ago.
Weekly Price Overview – 4 March 2026
Precious metals have corrected over the past two days after a strong late-February rally. Silver remains more volatile than gold. A weaker NZ dollar has supported local prices.
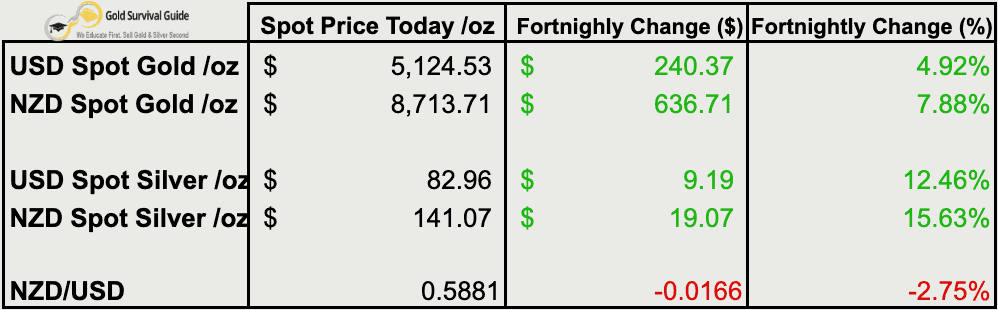
🟡 NZD gold rose $636.71 (+7.88%) to $8,713.71. Price recently broke above the $8,500–$7,600 consolidation range before pulling back sharply. The rising 50-day moving average near $8,100 remains a reasonable support area. Further sideways consolidation would be normal after such a strong advance.
USD gold gained $240.37 (+4.92%) to $5,124.53. Gold briefly broke above the $5,100 range ceiling before slipping back toward that level. Consolidation within the broader uptrend continues. Sideways pauses after strong rallies are common and often favour steady averaging rather than reacting to short-term swings.
⚪ NZD silver climbed $19.07 (+15.63%) to $141.07. After an initial surge toward $160 and an earlier spike near $200, silver has pulled back below its rising 50-day moving average near $142. Further consolidation looks likely, either sideways or through a corrective pattern before a clearer base forms.
USD silver increased $9.19 (+12.46%) to $82.96. Silver briefly pushed above $95 before dropping sharply over the past two days. Despite the volatility, price is back near late-last-year levels. Any dip toward the $70 region would likely represent a strong historical buying zone.
💱 NZD/USD fell 166 basis points (-2.75%) to 0.5881. The Kiwi has moved back below its first downtrend line and remains in a broader long-term downtrend. The weaker NZD has helped support local precious metals prices even as USD metals have corrected.
📈 Takeaway: Gold remains firm within its broader uptrend despite short-term volatility. Silver’s correction has been sharper, which is typical in strong bull phases. At this stage, the moves look like consolidation after an extended rally, not a structural reversal.
Missiles Flying. Metals Falling. And a Very Odd Expiry Week
If you had told most precious metals investors that the US would launch a major attack on Iran over the weekend, the expected reaction would have been straightforward.
Gold higher.
Silver higher.
Markets nervous.
Instead, we saw something very different.
Silver had rallied strongly into early Monday, touching the mid-$90s, and then over the next 30 hours fell more than 16%. Gold also pulled back. Equities were weak. The USD strengthened.
Chris Weber called it one of the strangest reactions he’s seen in decades watching silver. The timing didn’t line up with the headline risk.
So what’s going on?
Part of the answer may not be geopolitical at all.
Late last week, the CME halted trading across metals and natural gas, citing technical issues. It occurred right into silver futures expiry, with a large open interest still standing.
When a large number of silver contracts go into expiry, the exchange has to match buyers who want delivery with sellers willing to make delivery.
If there are more longs standing for metal than shorts prepared to deliver it, the exchange has a problem.
Vince Lanci described how this works from experience. In normal circumstances, the desk will call around and find someone to take the other side. That’s routine when it’s a handful of contracts.
But if the imbalance is large — if many buyers want delivery and too few want to sell — it becomes harder to keep the market orderly.
Halting trading buys time to sort out who will roll, who will settle, and who is prepared to deliver metal. Once trading resumes, the pressure often comes off the bid and price can fall sharply.
That’s exactly what we saw. Silver dropped hard into and after the halt.
This doesn’t make the war irrelevant. It suggests the expiry imbalance may have been the bigger driver of the move than the news out of Iran.
What History Tells Us About War and Gold and Silver
The team at In Gold We Trust shared a useful chart showing how gold and silver have reacted to geopolitical shocks going back to the 1979 Iranian hostage crisis.
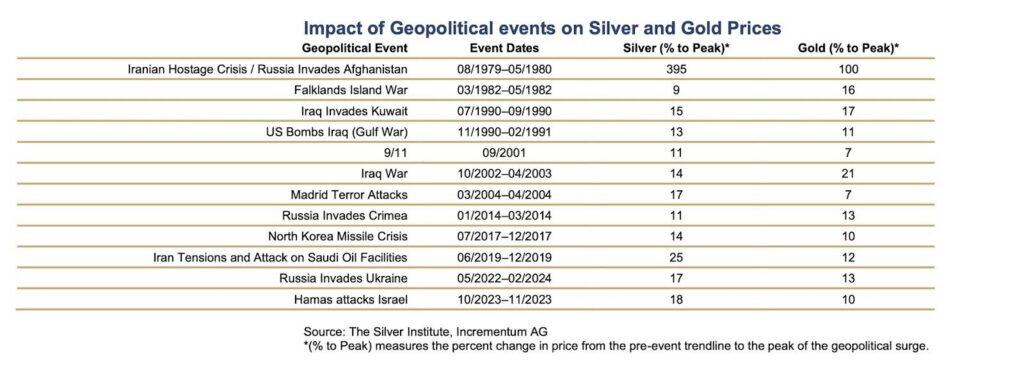
The pattern is fairly consistent:
- An initial spike.
- Volatility.
- Then a return to being driven by monetary forces.
We’ve written about this before here:
We haven’t yet updated that article for this latest outbreak, but the core principle still applies.
Wars can trigger sharp short-term moves. Sustained bull markets are driven by monetary breakdown, debt expansion, and loss of confidence in financial systems.
None of those pressures have eased.
If anything, they’ve intensified.
Chart of the Week: Perspective Matters
Some are already suggesting that if gold and silver can’t soar during a major Middle East escalation, perhaps the bull market is over.
That argument sounds reasonable — until you step back.
Jeff Clark recently compared the duration and percentage gains of major gold bull markets.
By his calculations, this current bull market is just over two years old.
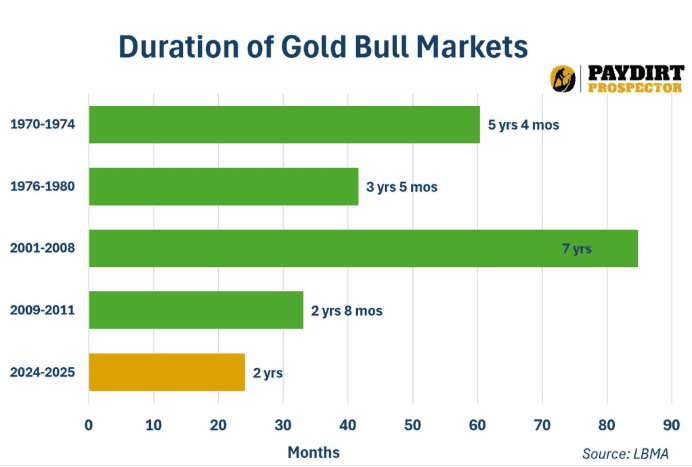
If it ended today:
- It would be the shortest major gold bull market in modern history.
- It would also be the smallest percentage gain on record.
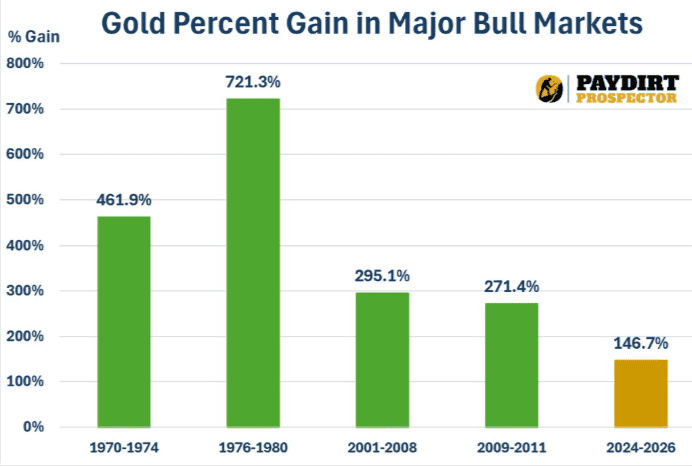
Historically, gold bull markets have lasted longer and delivered far greater gains than we’ve seen so far.
In that context, this doesn’t look like a late-stage blowoff. It looks early in the cycle.
And it’s also worth remembering something simple:
This conflict doesn’t reduce debt.
It doesn’t strengthen currencies.
It doesn’t repair the monetary system.
Those are the forces that drive sustained precious metals bull markets.
Short-term corrections — even sharp ones — are normal in gold and especially in silver. The structural backdrop hasn’t changed.
A few volatile days don’t end a bull market.
History suggests we’re still closer to the beginning than the end.
These dips likely remain good long term entry points. Get in touch if you’d like to start or add to your precious metals holdings.

Glenn's dedication to educating individuals on wealth protection through precious metals has helped over 2400 clients from New Zealand, Australia, USA and Europe to safeguard their financial futures. Passionate about financial independence and lifestyle freedom, Glenn’s mission is to empower others with the knowledge and tools to thrive in today’s volatile economic environment. When he's not advising on precious metals, Glenn enjoys spending time with his family and pursuing outdoor adventures.
Education: University of Auckland Bachelor of Science
Linkedin: https://www.linkedin.com/in/glenn-thomas-0984a4310/
- War, Oil and Gold: Market Implications of the Latest Middle East Conflict - March 11, 2026
- Is the Gold Bull Market Over? What the Charts Say - March 4, 2026
- Gold: Under-Owned, Under-Positioned — and Still Misunderstood? - February 18, 2026