
Gold
Gold: Under-Owned, Under-Positioned — and Still Misunderstood?
Feb
This Week:
- Weekly Price Overview – 18 February 2026
- Under-Owned, Under-Positioned – and Still [Mis]Understood?
- Allocation: The Bigger Picture
- Even the Wealthy Are Lightly Positioned
- Gold vs Equities: A Long-Term View
- 1973 or 1980?
- Volatility Around Chinese New Year
- A Small Observation From This Week
- Meme of the Week: Olympic Gold = Silver?
Weekly Price Overview – 18 February 2026
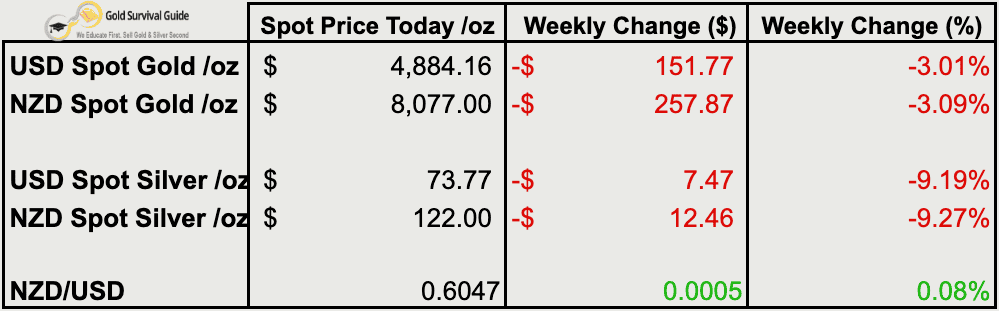
Precious metals pulled back this week, with silver correcting more sharply than gold. Both are now consolidating after their recent surge. The NZ dollar edged higher but remains in a long-term downtrend.
🟡 NZD gold fell $257.87 (-3.09%) to $8,077.00. Gold remains in a sideways range between roughly $7,600 and $8,500. The rising 50-day moving average near $7,900 continues to act as a reasonable support area. Further zigzag price action would not be unusual as the correction plays out.
USD gold dropped $151.77 (-3.01%) to $4,884.16. Price continues to consolidate between approximately $4,500 and $5,100. This pause within a broader uptrend is normal after a strong advance and often favours steady averaging in over trying to time short-term swings.
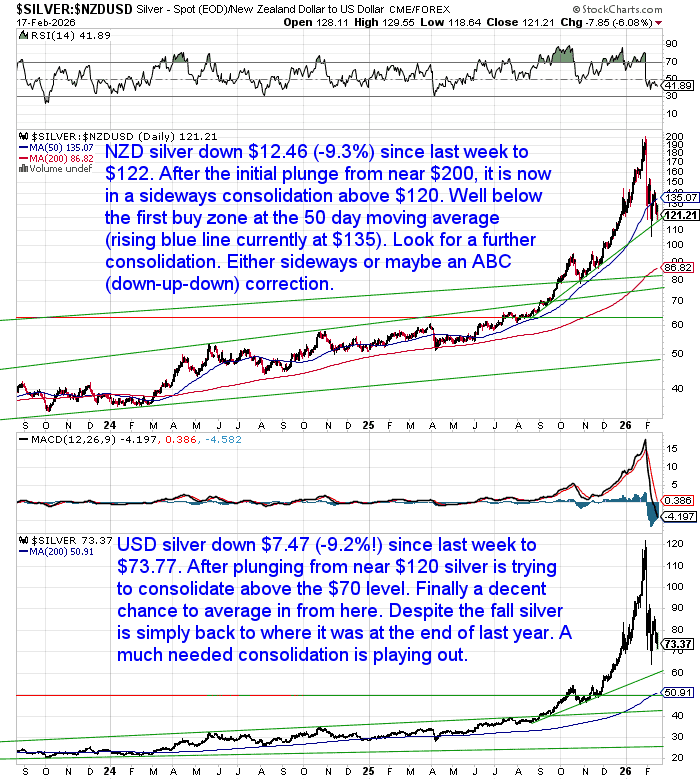
⚪ NZD silver declined $12.46 (-9.27%) to $122.00. After plunging from near $200, silver is now stabilising above $120 but remains below the rising 50-day moving average near $135. Further consolidation looks likely, either sideways or via an ABC-style correction.
USD silver fell $7.47 (-9.19%) to $73.77. The move has taken silver back toward late-last-year levels near $70. While volatile, this correction follows an extremely strong rally and may be necessary digestion before the next sustained move.
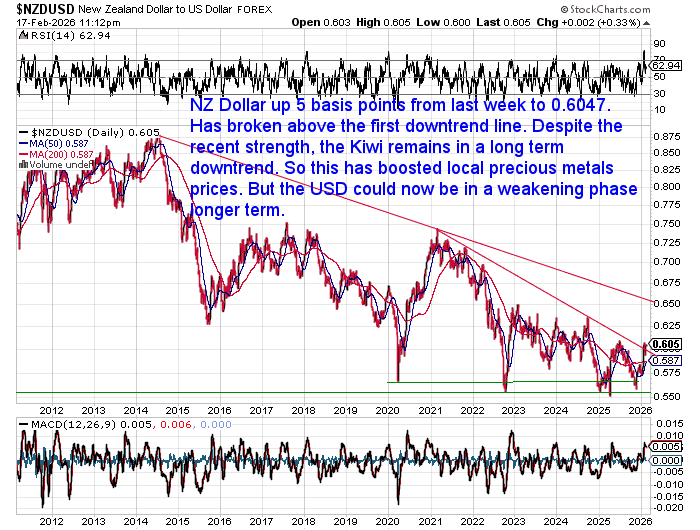
💱 NZD/USD rose 5 basis points (+0.08%) to 0.6047. The Kiwi has broken above its first downtrend line, though the broader trend remains downward. Short-term strength in the NZD has slightly softened local metal prices, but longer-term currency dynamics remain in play.
📈 Takeaway: Gold and silver are consolidating after a powerful run higher. Gold remains relatively firm within its range, while silver’s correction has been sharper and more volatile. At this stage, this looks like digestion rather than a structural reversal and may favour a disciplined averaging-in approach.

Under-Owned, Under-Positioned – and Still [Mis]Understood?
There’s been a lot of noise around gold lately.
Pullbacks. Volatility. Strong opinions both ways.
But if we step back from the daily price moves, something more important stands out.
Gold still appears to be structurally under-owned.
Allocation: The Bigger Picture
Adam Lockwood highlighted a useful point this week.
In the late 1970s and early 1980s, gold allocations of 6–8% were common.
Today, estimates suggest gold represents roughly 0.5% of global financial assets.
At the same time:
- Global GDP has expanded dramatically
- Financial assets have grown from trillions to hundreds of trillions
- Sovereign debt sits at record levels
Financial assets have multiplied.
Gold allocations have not.
Despite the talk, gold remains a small part of most portfolios.
Even the Wealthy Are Lightly Positioned
Ronni Stoeferle shared data from the J.P. Morgan Global Family Office Report.
- 72% of family offices hold zero gold
- The average allocation is just 0.9%
- Even those most concerned about geopolitics only hold around 2%
Geopolitics is listed as the top risk.
Yet gold, historically a neutral reserve asset, plays only a minor role.
Concern doesn’t always translate into allocation.
That shift, when it comes, is usually gradual — until it isn’t.
Gold vs Equities: A Long-Term View
Tavi Costa’s chart shows gold’s market cap as a percentage of global equities over more than a century.

Source.
Historically, the ratio has spiked during:
- World War I
- World War II
- The inflationary period of the late 1970s
Today, we remain well below those extremes.
Yet:
- Global debt is high
- Fiscal deficits appear structural
- Central banks still hold gold as a minority of reserves
- New discoveries are limited
So versus stocks, gold looks far from a crowded trade.
1973 or 1980?
Ted Butler offered a helpful comparison.
From 1971 to 1980, gold rose more than 20-fold.
From its 2024 breakout above $2,000 to recent highs near $5,000, gold has risen roughly 2.5 times.
That is significant.
But in context, it looks closer to the early 1970s than the final surge in 1980.
History never repeats exactly, but it often provides perspective.
Volatility Around Chinese New Year
Jaime Carrasco pointed out that in 2023, 2024, and 2025, Chinese New Year marked key inflection points.
Each time:
- Volatility increased
- Sentiment weakened
- Commentary turned negative
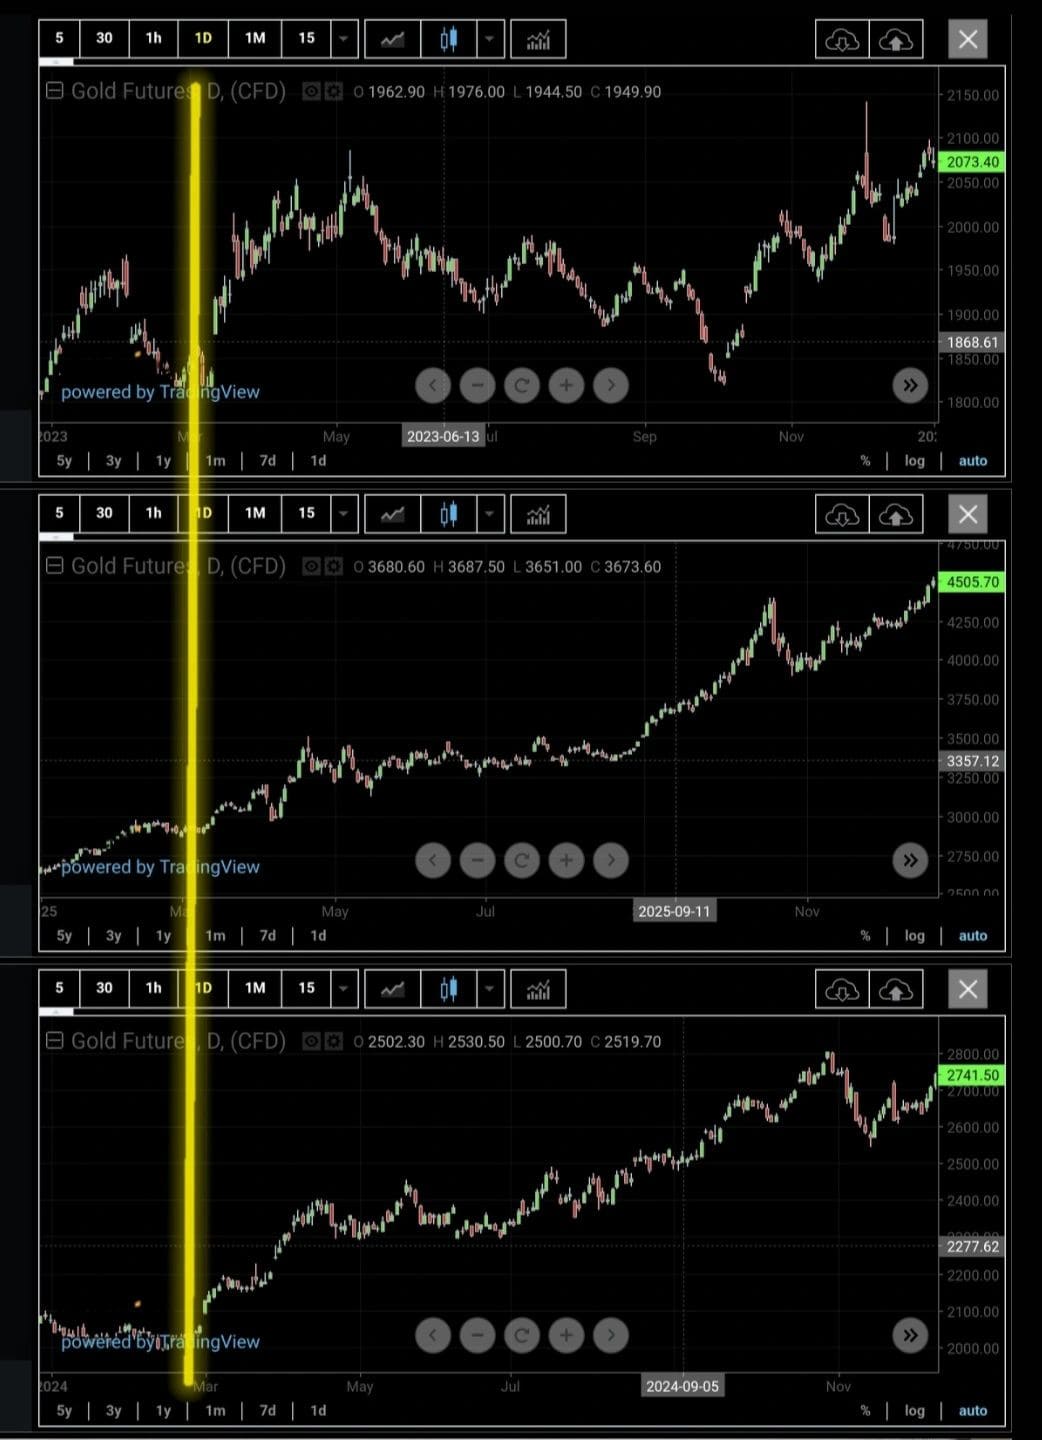
Each time, those periods marked important turning points.
His main point was not about timing the price.
It was about allocation.
If you understand why you own gold and silver, short-term volatility is easier to live with.
A Small Observation From This Week
Two weeks ago, when gold and silver fell sharply, demand surged.
We struggled to keep up.
This week, with gold down around 2% and silver down around 4%, buying activity has been noticeably quieter.
Lower prices.
Lower interest.
That is simply human nature.
From a long-term perspective, this type of consolidation is not unusual.
Often, these quieter periods are the ideal time to build a position.
Meme of the Week: Olympic Gold = Silver?

In 1912, it was solid gold.
Today, it is mostly silver with a thin layer of gold.
It’s a small detail, but perhaps a reflection of the times.
Gold may still be under-owned.
The real question is not where the price goes next week.
It is how much protection makes sense in a world of rising debt, persistent deficits, and monetary change.
As always, we encourage you to think first about allocation — not headlines.

Glenn's dedication to educating individuals on wealth protection through precious metals has helped over 2400 clients from New Zealand, Australia, USA and Europe to safeguard their financial futures. Passionate about financial independence and lifestyle freedom, Glenn’s mission is to empower others with the knowledge and tools to thrive in today’s volatile economic environment. When he's not advising on precious metals, Glenn enjoys spending time with his family and pursuing outdoor adventures.
Education: University of Auckland Bachelor of Science
Linkedin: https://www.linkedin.com/in/glenn-thomas-0984a4310/
- Gold Prices Fall as ETF Investors and Established NZ Buyers Keep Buying - October 14, 2026
- What Are The Different Types of Gold Bars? - October 13, 2026
- Should I Buy Gold Now or Wait? (2026 NZ Update) - October 12, 2026
