
Gold
Why the Netherlands Is Moving More of Its Gold Reserves to London

Sep
This Week:
- 📊 Weekly Price Overview – 9 September 2026
- Silver Caught Up With Gold — So What Happens Next?
- China Steps Up Gold Buying as the Netherlands Moves More Gold to London
- The Netherlands Moves More of Its Gold to London
- Gold Has Broken Its Old Relationship With Real Interest Rates
- What Does This Mean for Gold Versus Silver?
Estimated reading time: 7 minutes
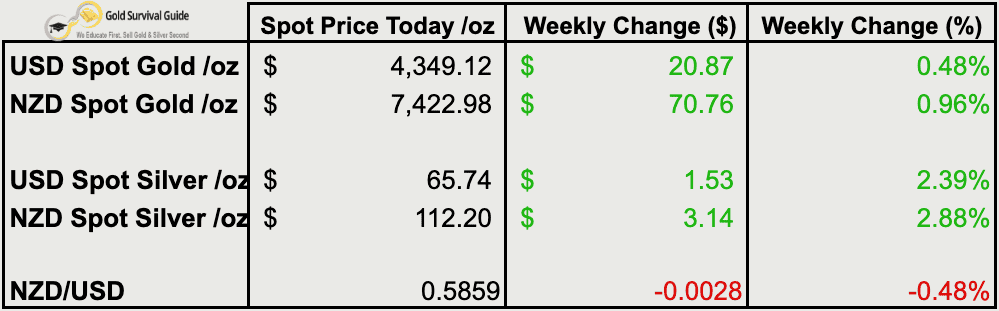
📊 Weekly Price Overview – 9 September 2026
Precious metals bounced back this week after last week’s sharp falls. Silver led the gains, while the Kiwi dollar weakened slightly.
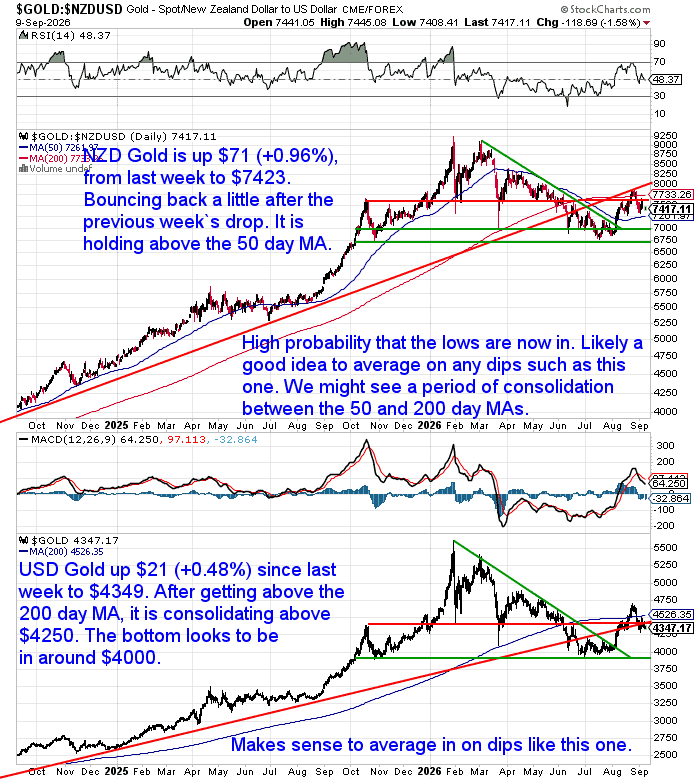
🟡 NZD gold rose $71 (+0.96%) to $7,423
NZD gold bounced after last week’s drop and remains above its 50-day moving average. The lows still look likely to be in, although some consolidation may follow.
USD gold rose $21 (+0.48%) to $4,349
USD gold is consolidating above $4,250 after moving back above its 200-day moving average. The $4,000 area still looks like an important bottom.
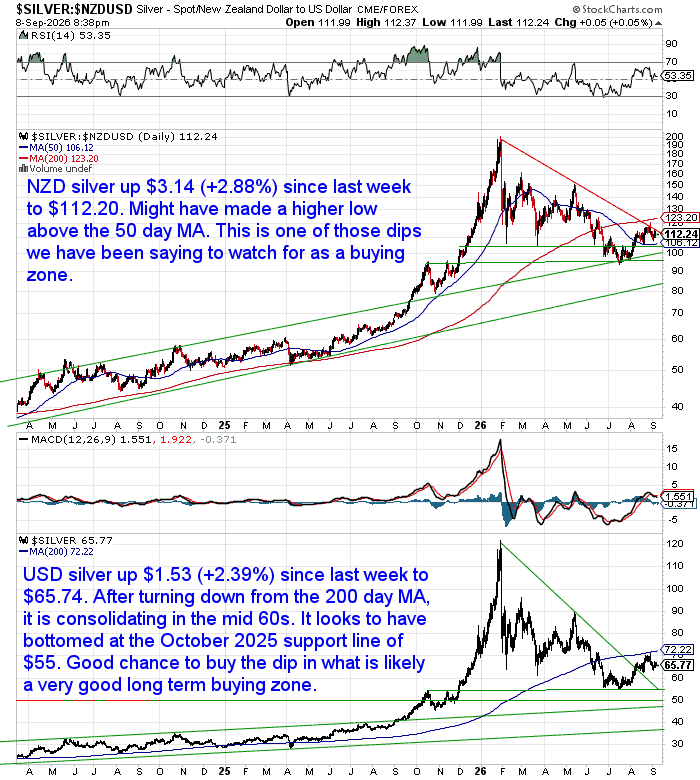
⚪ NZD silver rose $3.14 (+2.88%) to $112.20
NZD silver may have formed a higher low above its 50-day moving average. This remains one of the dips we’ve been watching for as a potential buying zone.
USD silver rose $1.53 (+2.39%) to $65.74
USD silver is consolidating in the mid-$60s after turning down from its 200-day moving average. The $55 support area still looks like an important bottom.
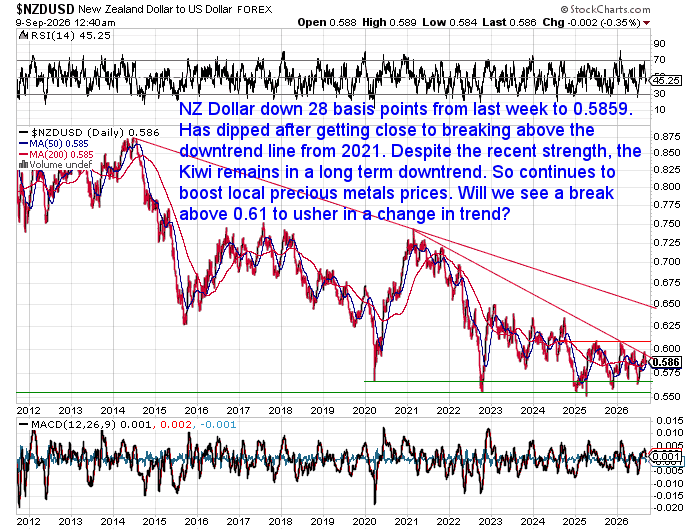
💱 NZD/USD fell 28 basis points (-0.48%) to 0.5859
The Kiwi dollar has pulled back after nearing its long-term downtrend line. It remains in a long-term downtrend, with a break above 0.61 potentially signalling a change.
Silver Caught Up With Gold — So What Happens Next?
Last year, the gold–silver ratio climbed above 100. This was a rare extreme that suggested silver had fallen a long way behind gold.
Silver then surged, briefly pushing the ratio below 50 earlier this year. Since then, it has climbed back to around 67.
So what is the gold–silver ratio telling us now? Does silver still offer better relative value than gold — or has that opportunity already passed?
This week’s featured article looks at what the ratio can (and can’t) tell us about the relative value of gold and silver.
Read: What Is the Gold Silver Ratio? What Is It Telling Us Now?

China Steps Up Gold Buying as the Netherlands Moves More Gold to London
The People’s Bank of China added another 650,000 ounces of gold in August. Its largest monthly addition since 2023 and its 22nd consecutive month of reported buying.
China had been steadily adding gold while prices weakened earlier this year. But in August, gold rose around 10%, while China made its largest monthly purchase in almost three years.
The higher price clearly didn’t deter China’s central bank from adding substantially to its reserves.
For them, gold’s reserve role appears to matter more than getting the lowest possible price.
The Netherlands Moves More of Its Gold to London
The Dutch central bank has also changed where it keeps a significant portion of its gold reserves.
Before the move, 31.3% of Dutch gold was held in New York. That has now fallen to 18.5%. Meanwhile, the share held in London has risen from 18.1% to 32.1%.
Importantly, the Netherlands hasn’t reduced the amount of gold it owns. It has changed where that gold is held and how readily it can be used.
Some online commentary has interpreted the move as evidence that the Netherlands is losing trust in the United States.
Clive Thompson cautions against that interpretation. His view is essentially: don’t overstate the story — look at what the Dutch central bank actually says.
DNB says the change improves the tradability of its gold and leaves it better prepared for a “severe crisis” amid increasing geopolitical unrest. It also describes gold as an “anchor of trust” and the “ultimate reserve asset”, ideally suited to hedge extreme systemic risks.
London is one of the world’s main physical gold trading centres. Holding more internationally tradeable bars there means DNB could mobilise its gold more readily if required.
DNB also tested different ways of moving its reserves. Some gold was physically transported, while other holdings were sold in New York and replaced in London. Experience with both methods could prove useful if one were unavailable during a future crisis.
There’s an important distinction here.
DNB isn’t predicting that a severe crisis is imminent. Governor Olaf Sleijpen said they expect never to need to use the gold. They’re making sure they’re prepared if they do.
This is remarkably similar to how we think about owning gold. You don’t buy insurance because you expect your house to burn down. You own it because the consequences matter if it does.
Frank Giustra takes a different view of the Dutch move.
His argument is: don’t just listen to what central banks say — watch what they’re doing. He sees these moves as a response to sanctions, geopolitical uncertainty and the risks of holding reserves within the US financial system.
Both perspectives have merit. DNB isn’t abandoning the US or forecasting an imminent crisis. But it is deliberately changing where its gold sits to improve its resilience if one occurs.
Gold Has Broken Its Old Relationship With Real Interest Rates
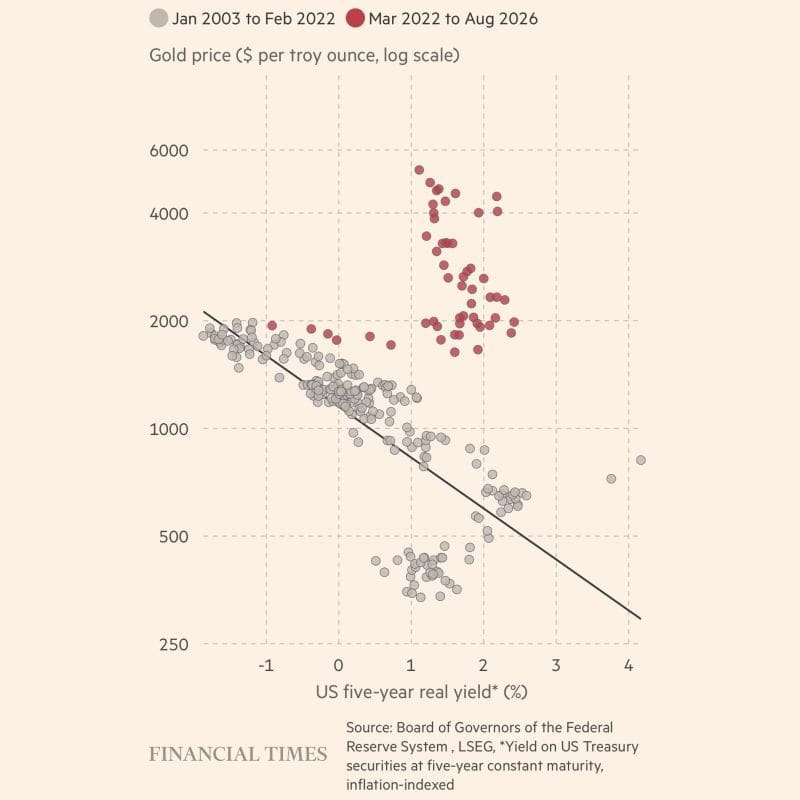
For years, rising US real yields generally meant falling gold prices. Gold pays no interest, so higher inflation-adjusted bond returns increased the opportunity cost of owning it.
The chart below shows how dramatically that relationship has changed.
Source: Financial Times via Charles-Henry Monchau
Since around 2022, real yields and gold have risen together — the opposite of what the old relationship suggested. Changing central-bank behaviour may help explain why.
In 2022, Western governments froze roughly $300 billion of Russian central-bank reserves following Russia’s invasion of Ukraine. It showed that foreign reserves held within the Western financial system could be frozen during a geopolitical dispute.
Physical gold held within a country’s own control is different. It carries no issuer or counterparty risk.
Since then, central-bank gold demand has remained historically strong. This week’s moves by China and the Netherlands fit that broader trend.
Frank Giustra sees this as part of a longer-term structural change in the monetary system. He describes three drivers for gold as the “debasement trade”, the “de-dollarisation trade” and the “insurance trade”.
As Barry Widdows observed when sharing this week’s chart:
“Ironically, as gold finds use in more portfolios, the harder it becomes to value.”
If buyers are increasingly acquiring gold for reasons that have little to do with interest rates, traditional valuation relationships may become less useful.
What Does This Mean for Gold Versus Silver?
Gold and silver are often grouped together, but they don’t have the same sources of demand.
Central banks hold gold as a monetary reserve asset. They don’t accumulate silver in the same way, while industrial demand plays a much larger role in the silver market.
So if central-bank buying is becoming a bigger influence on gold, historical relationships between the two metals may not always behave as they have in the past.
That’s another reason to treat the gold-silver ratio as a guide to relative value rather than a simple buy or sell signal.
Read: What Is the Gold Silver Ratio? What Is It Telling Us Now?

Glenn's dedication to educating individuals on wealth protection through precious metals has helped over 2400 clients from New Zealand, Australia, USA and Europe to safeguard their financial futures. Passionate about financial independence and lifestyle freedom, Glenn’s mission is to empower others with the knowledge and tools to thrive in today’s volatile economic environment. When he's not advising on precious metals, Glenn enjoys spending time with his family and pursuing outdoor adventures.
Education: University of Auckland Bachelor of Science
Linkedin: https://www.linkedin.com/in/glenn-thomas-0984a4310/
- NZ Inflation Could Hit 4.5%: What It Means for Gold - October 21, 2026
- What Type of Gold Bar Should I Buy? (Best Sizes, Brands & Bars Explained) - October 20, 2026
- Gold Prices Fall as ETF Investors and Established NZ Buyers Keep Buying - October 14, 2026
