

Table of contents
- 📊 Weekly Price Overview – 16 September 2026
- Silver Fell From US$120 to US$55 — So Where Are We in the Cycle?
- Are Commodities in a Longer-Term Bull Cycle?
- Saudi Oil Disruptions Push Prices Higher
- Bond Yields Are Rising — Including Here in New Zealand
- The Fed Is Expected to Raise Rates Tomorrow
- US Bullion Dealer Reports a Similar Silver “Shakeout”
Estimated reading time: 7 minutes
📊 Weekly Price Overview – 16 September 2026
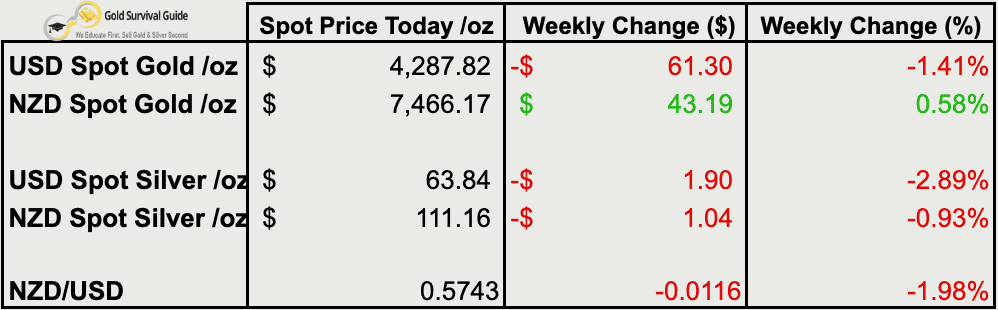
Precious metals fell in US dollars this week. But a weaker Kiwi dollar cushioned the falls locally, leaving NZD gold slightly higher.
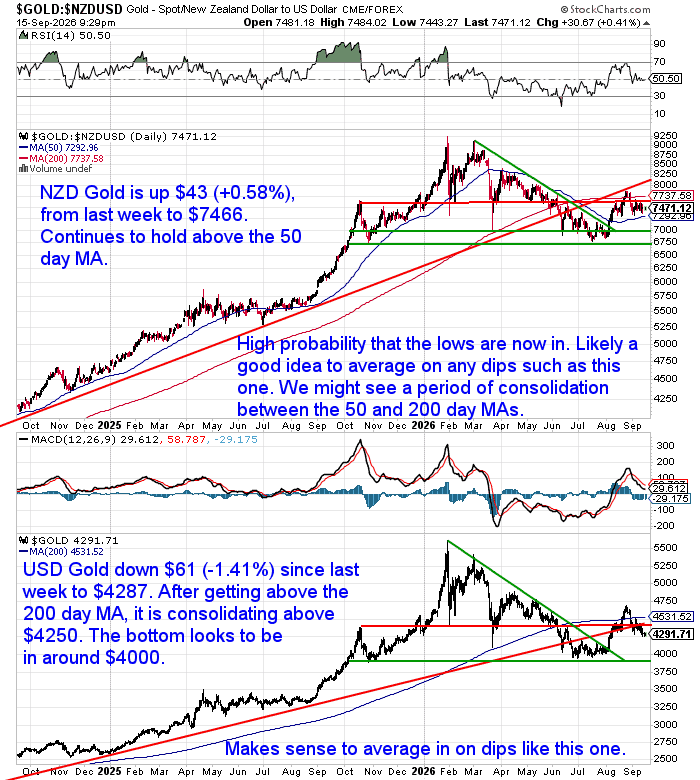
🟡 NZD gold rose $43 (+0.58%) to $7,466
NZD gold remains above its 50-day moving average. The lows still look likely to be in, although some consolidation may follow.
USD gold fell $61 (-1.41%) to $4,288
USD gold has pulled back after moving above its 200-day moving average. It remains above $4,250, with the $4,000 area still looking like an important bottom.
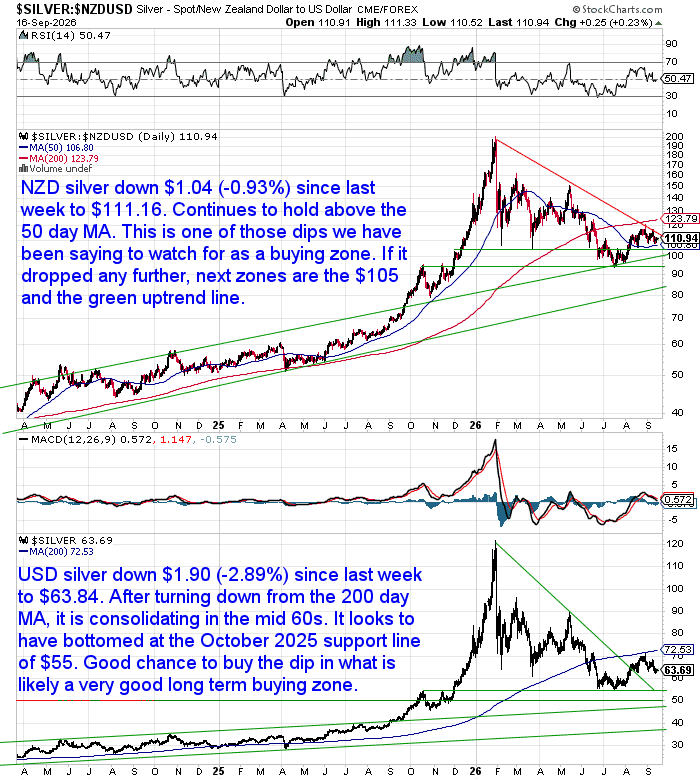
⚪ NZD silver fell $1.04 (-0.93%) to $111.16
NZD silver remains above its 50-day moving average. A further fall towards $105 would bring it into the next support and potential buying zone.
USD silver fell $1.90 (-2.89%) to $63.84
USD silver is consolidating in the mid-$60s after turning down from its 200-day moving average. The $55 support area still looks like an important bottom.
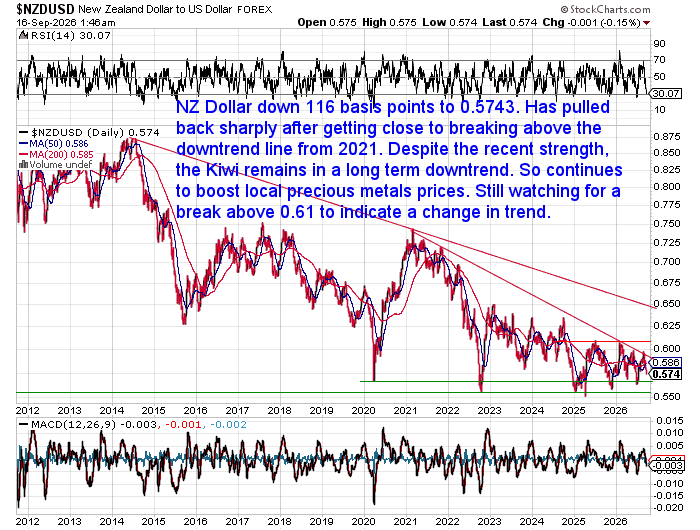
💱 NZD/USD fell 116 basis points (-1.98%) to 0.5743
The Kiwi dollar fell sharply as the US dollar strengthened ahead of an expected Fed rate hike. It remains in a long-term downtrend, with a break above 0.61 still needed to signal a change.
Silver Fell From US$120 to US$55 — So Where Are We in the Cycle?
A year ago, silver was trading around US$42 an ounce. By January it had surged above US$120 — before losing more than half its value in just a few months.
Was January the final euphoria stage of this silver bull market? Or was it a shorter-term speculative peak and correction within a much larger cycle?
We’ve compared today’s market with the 2011 peak, revisited the 45-year technical pattern we’ve been following, and looked at what silver investors are doing now.
Here in New Zealand, bullion buyers are behaving very differently from how they were at silver’s January peak. It may offer a clue about where we are in the cycle.
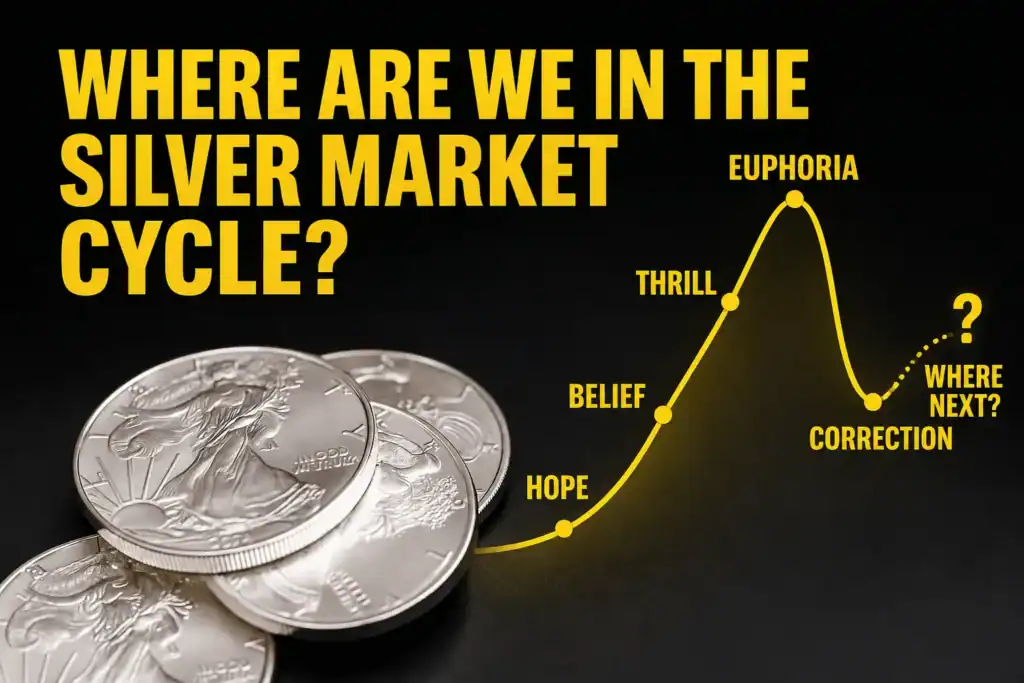
Read: Where Are We in the Silver Market Cycle?
Are Commodities in a Longer-Term Bull Cycle?
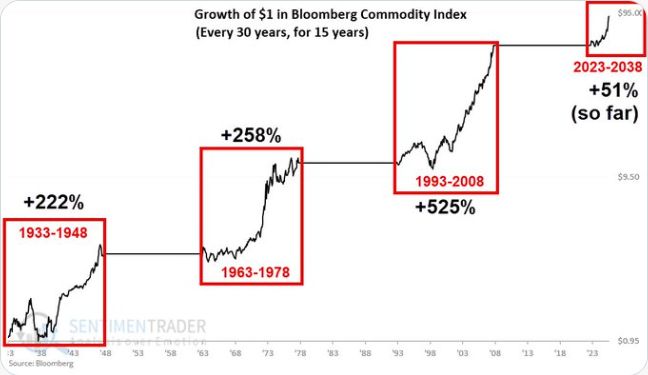
This Sentiment Trader chart compares the current Bloomberg Commodity Index cycle with three previous 30-year periods.
Source: Sentiment Trader via Jakob Riemann
In the 15 years from 1933, the index rose 222%. From 1963 it gained 258%. And from 1993 it rose 525%.
The latest period began in 2023. So far, the Bloomberg Commodity Index is up 51%.
Three historical periods don’t establish a reliable 30-year cycle. They do show how long previous commodity advances have lasted.
That longer-term perspective is also relevant to the silver market cycle we looked at in this week’s featured article.
Saudi Oil Disruptions Push Prices Higher
Oil is providing another reminder that the inflation problem hasn’t disappeared.
Saudi Arabia’s East-West pipeline was damaged last week, disrupting an important route to the Red Sea. Shipping through the Strait of Hormuz is already severely restricted.
Crude loadings at Saudi Arabia’s Yanbu export terminal have since been suspended. Some deliveries to European customers have also been cancelled, while physical European crude cargoes have traded above US$130 a barrel. (Source: Reuters)
Meanwhile, shipping through Hormuz remains a fraction of normal levels. Just four commodity vessels passed through on Monday, compared with an average of around 125 per day before the war. (Source: Reuters)
Transport costs have also surged, making already expensive oil even more costly to move around the world.
Bond Yields Are Rising — Including Here in New Zealand
Higher oil prices are adding to an already difficult backdrop for bond markets.
Government bond yields have risen sharply across the US, UK and Europe. German yields recently reached their highest levels since 2011. US and UK yields have climbed to around 20-year highs.
New Zealand hasn’t escaped the move.
Amova Asset Management fixed-interest manager Matthew Johnson says the NZ 10-year government bond yield is significantly above his estimate of neutral. He says yields have rarely remained this high for long.
Johnson argues that current yields leave investors well compensated for holding longer-dated NZ government bonds. How rewarding those yields prove will depend partly on what happens to inflation.
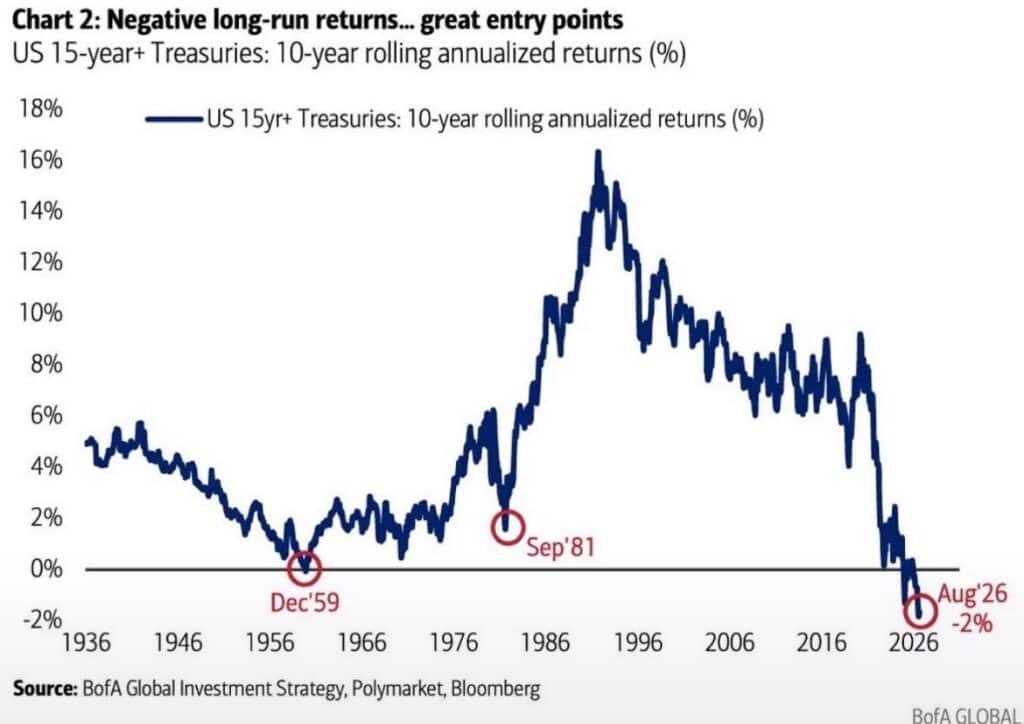
Source: BofA Global Investment Strategy, via Matt Oliver
The 10-year rolling annual return from US Treasury bonds with maturities of 15 years or more has now fallen to around -2%. That’s the lowest level in roughly 100 years.
The last two occasions when returns approached these levels were around 1959 and 1981.
A “safe” government bond can still produce a very poor long-term return when bought at the wrong price.
The Fed Is Expected to Raise Rates Tomorrow
The US Federal Reserve meets this week with inflation still stubborn and oil prices rising again.
A growing number of major banks expect the Fed to raise rates this week. Morgan Stanley expects a 0.25% rise tomorrow and another increase in December.
Yet gold and silver have remained resilient. Gold is around US$4,294 today, while silver is around US$63.76, despite rising bond yields and expectations of tighter US monetary policy.
In the latest Weber Report, veteran precious-metals dealer Robert Mish notes that markets can become fixated on individual Fed announcements. Yet the initial price reaction can quickly reverse.
For precious metals, he considers the real interest rate — the interest rate after inflation — more important than the headline Fed rate.
So probably don’t read too much into the first move after tomorrow’s Fed decision.
US Bullion Dealer Reports a Similar Silver “Shakeout”
Mish is also seeing something in the US physical market that looks remarkably similar to what we’re seeing here in New Zealand.
He describes the current precious-metals market as a “shakeout” after gold and silver rose too far, too quickly earlier this year. He’s also seeing unusually low premiums on a range of physical gold and silver products.
We’re seeing much the same thing.
At silver’s January peak, buyers were chasing metal above US$100. Products became difficult to source and premiums rose sharply.
Today wholesale premiums are substantially lower and buying interest is unusually quiet.
Buyers were eager when silver was expensive and are much more cautious now that both the metal and physical premiums are cheaper.
If you’re considering adding to your silver holdings at today’s lower prices and premiums, get in touch with us below.

Glenn's dedication to educating individuals on wealth protection through precious metals has helped over 2400 clients from New Zealand, Australia, USA and Europe to safeguard their financial futures. Passionate about financial independence and lifestyle freedom, Glenn’s mission is to empower others with the knowledge and tools to thrive in today’s volatile economic environment. When he's not advising on precious metals, Glenn enjoys spending time with his family and pursuing outdoor adventures.
Education: University of Auckland Bachelor of Science
Linkedin: https://www.linkedin.com/in/glenn-thomas-0984a4310/
- Bond Yields Are Rising — Including Here in New Zealand - September 16, 2026
- Where Are We in the Silver Market Cycle? - September 15, 2026
- Why the Netherlands Is Moving More of Its Gold Reserves to London - September 9, 2026
