
This Week:
Estimated reading time: 7 minutes
Weekly Price Overview – 6 May 2026
Precious metals were mixed this week, with gold easing slightly while silver held firm. The broader uptrend remains intact, though short-term consolidation continues.
🟡 NZD gold fell $59.67 (-0.76%) to $7,759.64
NZD gold slipped back after rebounding from the 200-day MA near $7,300 in March. It briefly reclaimed the 50-day MA before easing lower. Price is currently sitting near an important support level from late 2025. The long-term uptrend remains intact, and any move back toward the 200-day MA would likely offer a strong long-term buying zone.
USD gold dropped $32.76 (-0.71%) to $4,565.00
USD gold also eased lower after rallying strongly off the 200-day MA near $4,270. Price rebounded toward $4,850 before consolidating. The broader trend remains bullish, with any deeper pullback toward the 200-day MA likely presenting value for long-term investors.
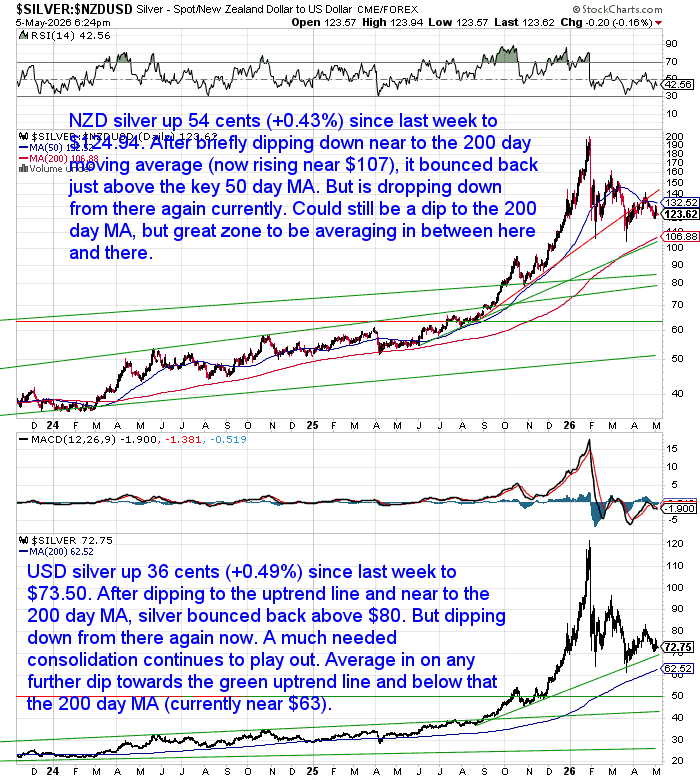
⚪ NZD silver rose $0.54 (+0.43%) to $124.94
NZD silver held up well this week after bouncing from near the 200-day MA around $107. It reclaimed the 50-day MA but is now easing again. Volatility remains elevated, though the broader trend is still positive. Dips between the 50-day and 200-day MAs continue to look attractive for averaging.
USD silver gained $0.36 (+0.49%) to $73.50
USD silver rebounded after testing the uptrend line and the 200-day MA near $63. It pushed back above $80 before easing slightly. Consolidation continues after the sharp rally, with any further dip toward the 200-day MA likely offering good long-term value.
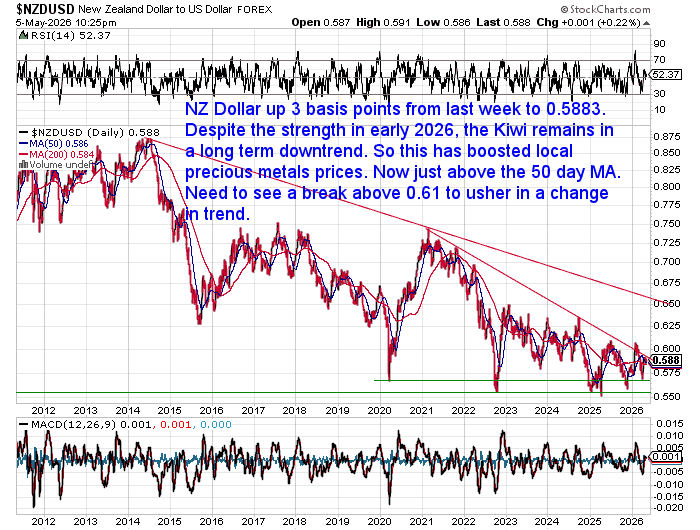
💱 NZD/USD rose 3 basis points (+0.05%) to 0.5883
The Kiwi dollar remains in a long-term downtrend despite strength earlier this year. That continues to support NZD precious metals prices. NZD/USD is now sitting just above the 50-day MA, but a sustained move above 0.61 is still needed to signal a broader trend reversal.

Gold or Silver — Which Should You Buy Right Now?
This is one of the most common questions we get:
Should you buy gold or silver?
The answer depends on your goals – and most people get this wrong.
We’ve just updated our full guide breaking down:
- When gold is the better choice
- When silver has more upside
- And the 7 key factors you should consider before buying
Read the full guide here:
[Should I Buy Gold or Silver?]
If you’re thinking about buying precious metals right now, this will help you make the right decision.

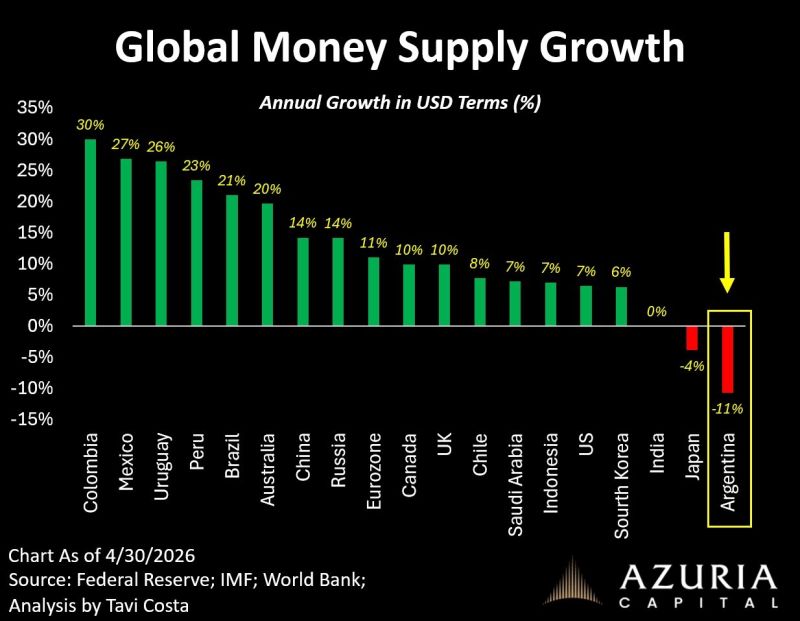
Currency Supply Growth Continues Despite Higher Inflation
Despite inflation remaining well above long-term averages in many countries, global money supply growth continues almost everywhere.
Macro analyst Tavi Costa recently pointed out that Argentina is currently the only major country contracting money supply at a double-digit rate.
Meanwhile, most of the world continues expanding credit and debt with very little monetary discipline.
Over time, expanding currency supply tends to push up the price of assets, property, commodities, and eventually everyday goods.
In other words, more currency is chasing the same goods, assets, and resources.
Costa summed it up simply:
“None of us own enough hard assets.”
That does not just mean gold and silver. It can also include energy, farmland, commodities, and productive businesses.
Hard assets have historically performed well when money supply expands and currencies lose purchasing power.
Will Feed the Next Commodity Cycle Boom
Ongoing currency expansion is one reason commodity prices may stay higher for years.
The longer-term Bloomberg Commodity Index chart below shows commodities historically move in large multi-year cycles. Previous commodity bull markets lasted roughly 15 years.
The current cycle may still be in its early stages.
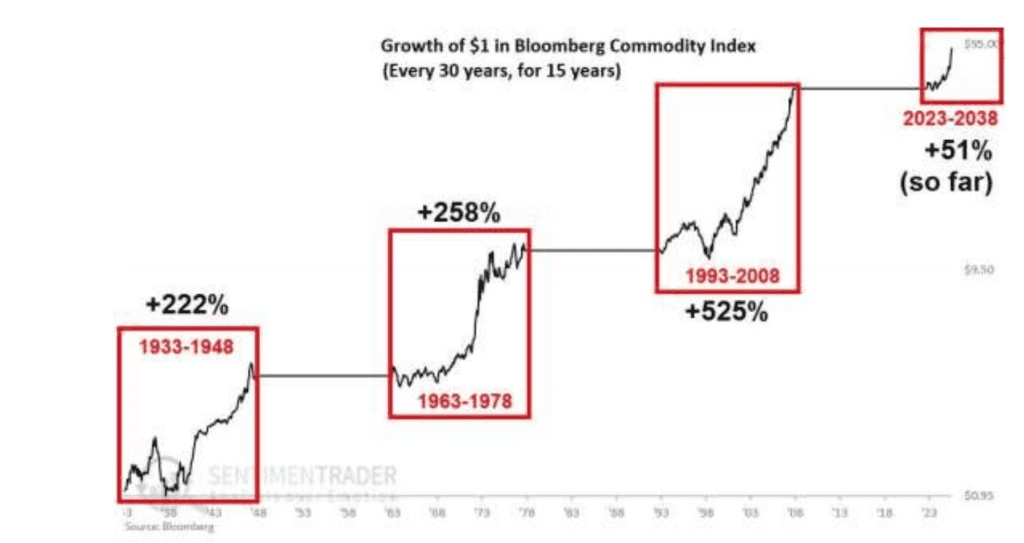
If credit growth and government spending keep accelerating, higher commodity prices should not surprise investors.
That environment is also one reason why portfolio diversification matters more than ever.
How to Structure Your Investment Portfolio
Stop Trying to Predict Every Market Move
One of the biggest mistakes investors make is trying to constantly predict what comes next.
Should you own stocks? Bonds? Cash? Gold? Crypto?
Most people end up chasing last year’s best-performing asset — usually buying high and selling low.
This week, billionaire hedge fund manager Ray Dalio summed up the problem well:
“Most investors make the mistake of trying to ‘time’ the market… The better approach? Build a balanced, highly diversified strategic asset allocation that can weather any environment.”
Importantly, Dalio also said that allocation should include between 5% and 15% in gold.
Why Diversification Still Matters
Gold is often misunderstood. Many still see it as a “doomsday” asset or something only bought during crises. But gold’s real role is portfolio balance and long-term wealth protection.
In fact, recent data shared by Dean Chrastina showed something surprising.
Since 2000, gold has actually outperformed Berkshire Hathaway stock. But even more interesting was this:
A portfolio split 50/50 between Berkshire shares and gold outperformed both individually — while also reducing volatility by nearly 33%.
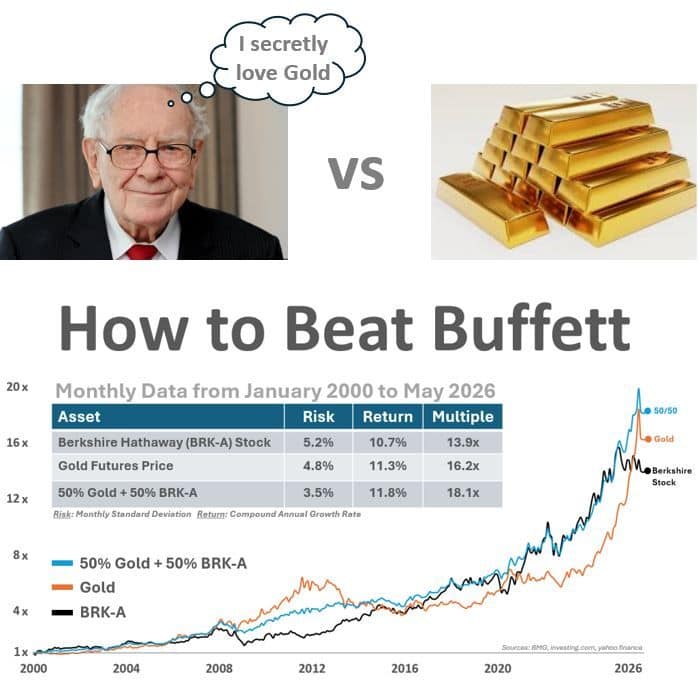
That is the real power of diversification.
Different assets perform well at different times. Productive businesses can create enormous wealth over decades. But hard assets like gold can help offset currency debasement, financial instability, and periods where traditional markets struggle.
The goal is not to pick one ‘winning’ asset.
It should be building a portfolio that can survive different economic environments.
Gold’s Long-Term Track Record
And gold’s consistency over the last 25 years has been remarkable.
According to the latest In Gold We Trust Report, gold remains positive in every major currency this year despite two sharp corrections in 2026.
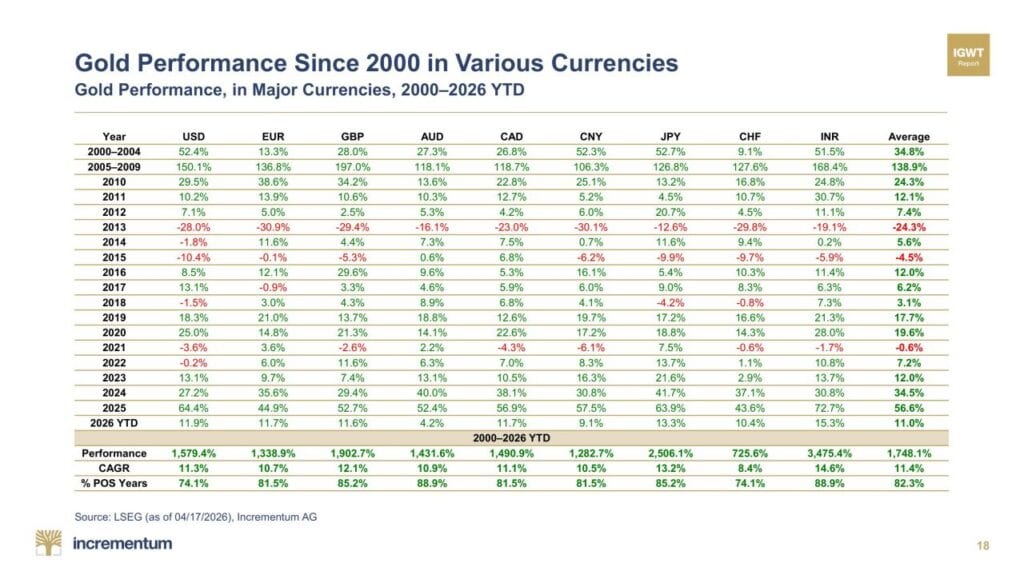
Since 2000, gold has delivered:
- 11.3% annualised returns in USD
- 11.4% average annual returns across major global currencies
- Positive yearly returns roughly 82% of the time
That level of long-term consistency is rare.
The key takeaway is not that investors should go “all in” on gold. We have never argued that.
Many portfolios remain heavily concentrated in financial assets tied to the same financial system. Gold and silver can act as financial insurance against that concentration risk.
For many investors, the bigger risk may not be owning too much gold. It may be owning none at all.
For more on this topic, read our guide:
How Much Gold and Silver Should Be in Your Portfolio?
And if you’d like help building a precious metals allocation that fits your goals and risk tolerance, feel free to reply to this email or call us on 0800 888 465.
We’re always happy to help you think through your options before making any decisions.

Glenn's dedication to educating individuals on wealth protection through precious metals has helped over 2400 clients from New Zealand, Australia, USA and Europe to safeguard their financial futures. Passionate about financial independence and lifestyle freedom, Glenn’s mission is to empower others with the knowledge and tools to thrive in today’s volatile economic environment. When he's not advising on precious metals, Glenn enjoys spending time with his family and pursuing outdoor adventures.
Education: University of Auckland Bachelor of Science
Linkedin: https://www.linkedin.com/in/glenn-thomas-0984a4310/