Introduction: Gold’s New Phase Begins
Gold recently surged to a new all-time high of nearly $3,500 — before pulling back slightly.
Some investors are now wondering: Was that it? Is this rally overdone? Is a blow-off top imminent?
The short answer: no.
This isn’t a typical market cycle driven by sentiment and technicals.
Instead, it reflects something deeper — a slow-motion monetary realignment. Confidence in sovereign bonds, fiat currencies, and even central banks is being quietly but steadily eroded.
Gold isn’t rising because it’s fashionable.
It’s rising because the foundation beneath global finance is cracking.
If you’re asking why is gold rising now, the answer isn’t in the charts — it’s in the system.
In this article, we’ll show why this latest parabolic gold move is likely the beginning of its most important phase yet — not the end.
Table of contents
- Introduction: Gold’s New Phase Begins
- Central Banks Are Quietly Rewriting the Rules
- Gold Isn’t Overbought — The System Is Overextended
- The Big Picture: A Gold Bull Market in Motion
- Today’s Rally Is Nothing Like the 1980s — Yet
- The Money Printer Tells the Real Story
- Why Gold’s Move Feels Silent — but Isn’t Small
- Conclusion: It’s Not a Gold Bubble — It’s a Monetary Reset
- Silver: The Undervalued Opportunity
- Questions About Parabolic Gold and the New Bull Market?
Estimated reading time: 8 minutes
Central Banks Are Quietly Rewriting the Rules
While retail investors obsess over charts and “overbought” signals, a much bigger shift is happening behind the scenes — led by sovereign wealth.
🔎 According to Tavi Costa of Crescat Capital, foreign central banks are aggressively transitioning toward gold:
- Foreign holdings of US Treasuries (as a % of total government debt) are plunging
- Meanwhile, gold’s share of international reserves is rising at a record pace

📈 As Costa explains:
“We are likely in the midst of a monetary realignment. Attempting to time short-term corrections based on overbought conditions misses the forest for the trees. Structural macro imbalances are compelling governments to accumulate gold.”
This isn’t technical trading.
It’s structural repositioning.
And Jan Skoyles echoes this point (see video below):
“Central banks don’t wait for dips. They don’t refresh charts. They don’t time entries. They accumulate the risk-free asset before the risks show up in the headlines.”
Meanwhile, retail investors — conditioned by decades of stock market behavior — often wait for dips that never come.
By the time gold feels like a “safe” buy, it may already be scarce, gated, or heavily premiumed.
🎥 Watch: “Gold Hit $3,500 — Then Something Strange Happened”
In this 12-minute video, Jan Skoyles breaks down why central banks don’t wait for dips — and why investors miss the message gold is sending.
📌 Quick Fact:
In 2024–25 alone, central banks added more gold to their reserves than at any point since the late 1960s.
Gold Isn’t Overbought — The System Is Overextended
At a glance, it’s tempting to think gold is “overbought.”
After all, technical indicators like RSI (Relative Strength Index) have touched overbought multiple times this year.
But in a monetary reset, the usual playbook goes out the window.
Today’s financial system is stretched thinner than it has been in decades:
- Global debt levels are at historic highs
- Major bond markets are showing signs of illiquidity
- The IMF recently warned that “financial stability risks have increased significantly”
“If the outlook worsens, valuations could drop further, leading to tighter global financial conditions,” the IMF report states. It highlights leverage among asset managers, margin call risks, and the growing stress in sovereign bond markets.
In this environment, trading gold like a short-term asset may be the wrong mindset.
It’s not about “timing” — it’s about positioning.
Gold isn’t expensive. Rather the system is unstable.
The Big Picture: A Gold Bull Market in Motion
If you’re concerned this parabolic gold move has gone too far, too fast — take a step back.
🔎 Technical analyst Graddhy shared this powerful 53-year chart of gold price action:
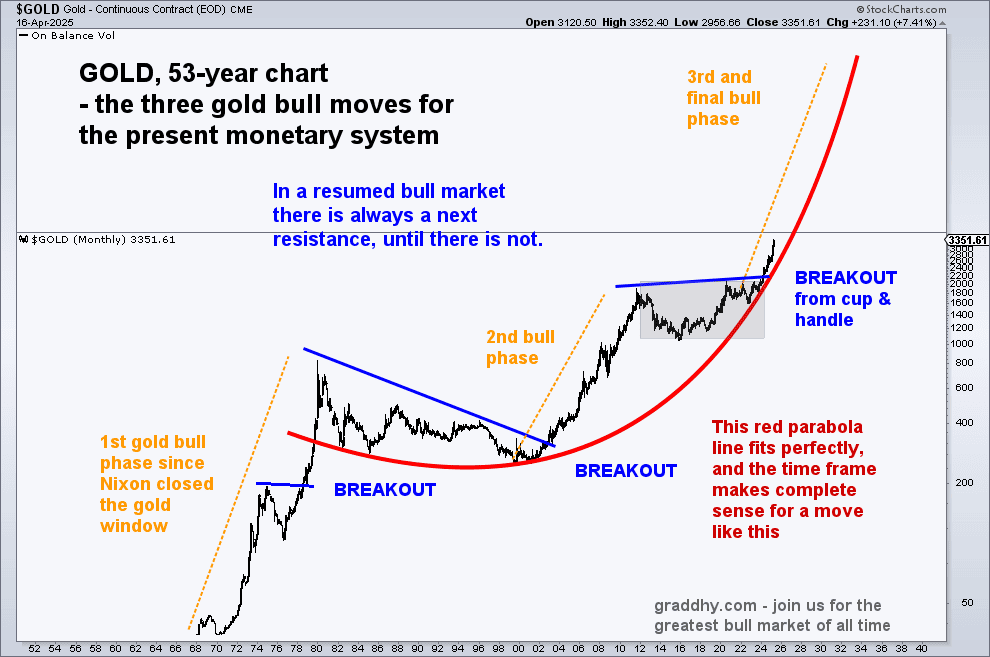
The chart outlines three clear phases of gold bull markets:
- 1970s boom (ending in 1980)
- 2000s run (ending in 2011)
- Current breakout (began forming in 2016–2022)
Graddhy believes this final leg is just beginning, not ending — part of a multi-decade pattern in motion.
That said, he also adds a word of caution:
“This very simple big picture chart is still on track. But on smaller timeframes, gold now looks quite extended.”
In other words: the trend is up — but sharp pullbacks are part of the ride.
And for retail investors, waiting for a perfect entry may mean sitting out the next major leg higher.
This is a secular shift — not a sprint.
Today’s Rally Is Nothing Like the 1980s — Yet
Many investors fear that today’s gold rally mirrors the late 1970s — a sharp parabolic spike followed by a brutal crash.
But so far, the data shows otherwise.
🔎 Compare the magnitude and speed of gold’s rise in 1979–1980 with today’s action:
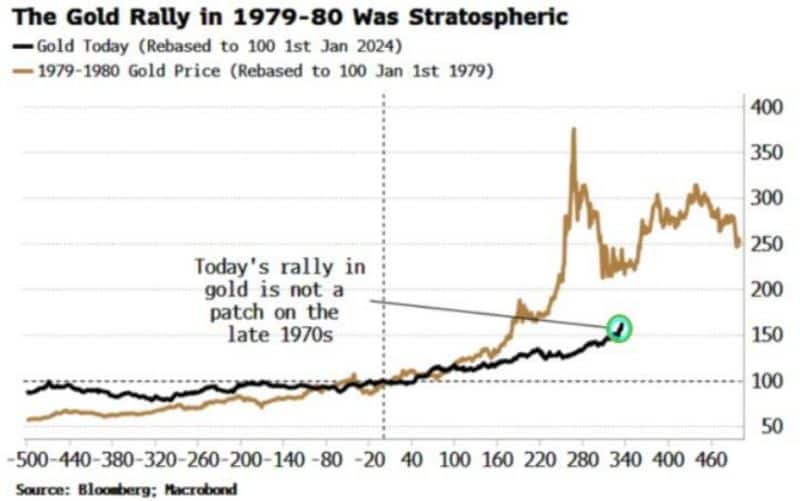
- In the final 18 months of the 1970s bull market, gold more than quadrupled in price
- Today’s rally — while impressive — is still orderly and relatively under-owned
Importantly, in 1980, gold was being chased by speculators in a final panic move.
Today, gold’s ascent is being led quietly by central banks, institutions, and sovereign entities — not frenzied retail traders.
If you’re wondering how high gold can go, we explored this in depth here:
🔗 How Do You Value Gold? What Price Could It Reach?
The Money Printer Tells the Real Story
Another reason this isn’t just another gold rally:
The monetary backdrop has changed — permanently.
The speed at which the U.S. government is creating new dollars is accelerating at a pace few investors fully appreciate.
🔎 Just look at how fast it now takes to print each new $1 trillion:
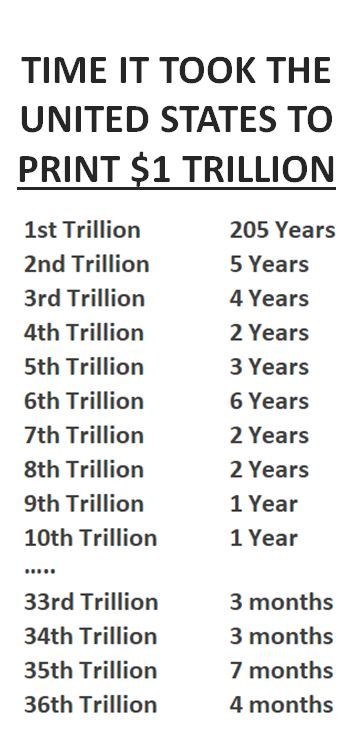
- It took the United States 204 years (1776–1980) to issue its first $1 trillion of national debt
- In contrast, it now routinely adds $1 trillion in under 100 days
This explosive expansion of money — with no corresponding growth in real productivity — erodes trust in fiat currencies.
And as Dean Chrastina neatly put it:
“Who wants to hold U.S. dollars when there’s an alternative that can never go bankrupt: gold.”
Why Gold’s Move Feels Silent — but Isn’t Small
One of the most striking features of gold’s latest surge is how quiet it feels.
No media frenzy.
No retail stampede.
No euphoria.
As Jan Skoyles notes:
“Retail investors are still waiting for pullbacks. They refresh charts. They ask whether $3,000 is overbought.
Meanwhile, central banks aren’t waiting. They’re quietly accumulating before the risks appear in the headlines.”
This is classic bull market behaviour — the early stages where the smart money moves first, while the crowd hesitates, anchored to yesterday’s price anchors.
📈 The lesson:
The biggest moves happen while most investors are still debating whether to get in.
Conclusion: It’s Not a Gold Bubble — It’s a Monetary Reset
To call this a “bubble” misunderstands the scale of what’s happening.
This isn’t a speculative frenzy.
It’s a global repositioning in response to:
- Sovereign bond instability
- Unprecedented debt creation
- A shrinking appetite for U.S. dollars as reserves
- A reawakening to gold’s historical role as a store of value without counterparty risk
We’ve recently explored how sovereign bond markets — once considered “risk-free” — are now flashing warning signs.
🔗 Read more: Why the World Is Losing Faith in US Treasuries — And Turning to Gold
Short-term pullbacks are inevitable — and perhaps healthy.
But the direction of travel is clear.
The system is quietly telling you what comes next.
For investors watching this parabolic gold breakout unfold, the message is clear:
This is not about hype — it’s about hedging.
Silver: The Undervalued Opportunity
If you’re concerned about a potential steeper correction in gold, silver is a pretty compelling alternative. Historically, silver tends to lag behind gold during initial rallies but often accelerates rapidly in subsequent phases. Currently, the gold-to-silver ratio is at a level sen only a handful of times in history. This indicates that silver is significantly undervalued relative to gold. This disparity suggests that silver may be poised for a substantial catch-up. For a deeper analysis, refer to our recent article: Gold Silver Ratio 2025: Is Silver Undervalued Again?.
👉 Buy gold or silver securely online
Or talk to us here if you’d like help reviewing your options.
Questions About Parabolic Gold and the New Bull Market?
“Parabolic gold” refers to the accelerating, almost vertical rise in the gold price over a short period. It signals strong momentum, but unlike speculative bubbles, this current move is being driven by deep structural shifts in the financial system — not retail euphoria.
While some technical indicators suggest gold is overbought, history shows that during monetary resets, traditional signals lose relevance. Gold’s rise reflects systemic risk, not just short-term sentiment. Waiting for a perfect entry could mean missing the bigger move.
Unlike the 1979–1980 gold spike driven by retail panic, today’s rally is quieter and steadier, led by sovereign and central bank buying. Gold’s recent move is orderly, and accumulation is happening long before the mainstream headlines catch up.
Central banks are hedging against risks in the U.S. dollar, sovereign debt, and broader financial instability. Gold offers a safe, liquid asset without counterparty risk — especially critical as global trust in traditional financial structures declines.
Yes, even in strong bull markets, pullbacks are natural and healthy. Gold may experience sharp dips on its way higher, but the long-term trend remains intact. Investors focusing only on short-term moves risk missing the broader structural reset underway.

Glenn's dedication to educating individuals on wealth protection through precious metals has helped over 2400 clients from New Zealand, Australia, USA and Europe to safeguard their financial futures. Passionate about financial independence and lifestyle freedom, Glenn’s mission is to empower others with the knowledge and tools to thrive in today’s volatile economic environment. When he's not advising on precious metals, Glenn enjoys spending time with his family and pursuing outdoor adventures.
Education: University of Auckland Bachelor of Science
Linkedin: https://www.linkedin.com/in/glenn-thomas-0984a4310/
- Central Banks Continue Building Their Gold Reserves - July 8, 2026
- Could New Zealand Rebuild Its Gold Reserves? - July 7, 2026
- Why You Should Become Your Own Central Bank - June 28, 2026