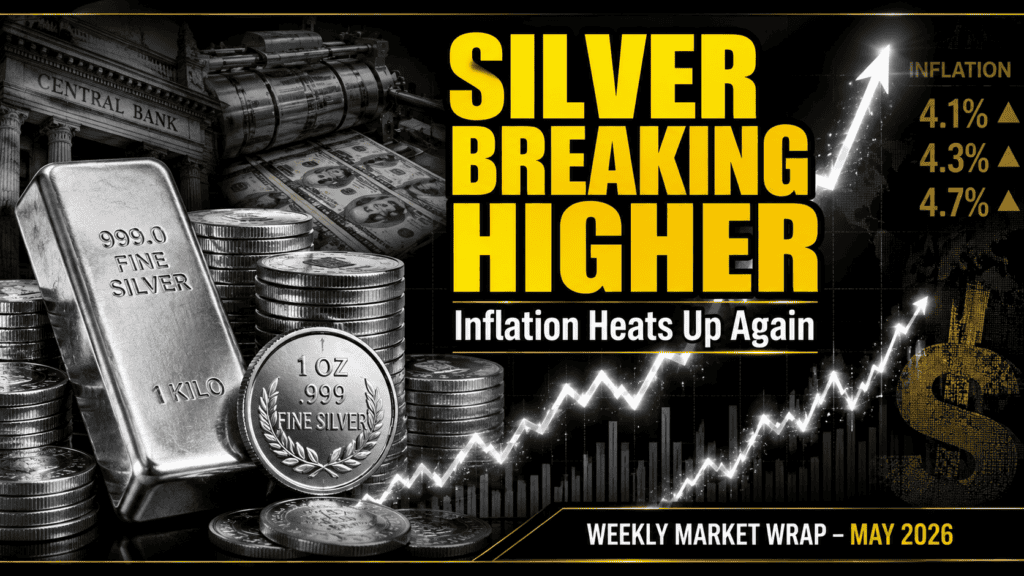
This Week:
- Weekly Price Overview – 13 May 2026
- What Type of Gold Bar Should I Buy in 2026?
- Does Gold Seasonality Affect the NZ Dollar Gold Price?
- Currency Supply Growth Continues
- Silver Appears to be Breaking Higher
- Silver Still Strong Across Global Currencies
- But Silver Still Looks Cheap Relative to Financial Assets
Estimated reading time: 7 minutes
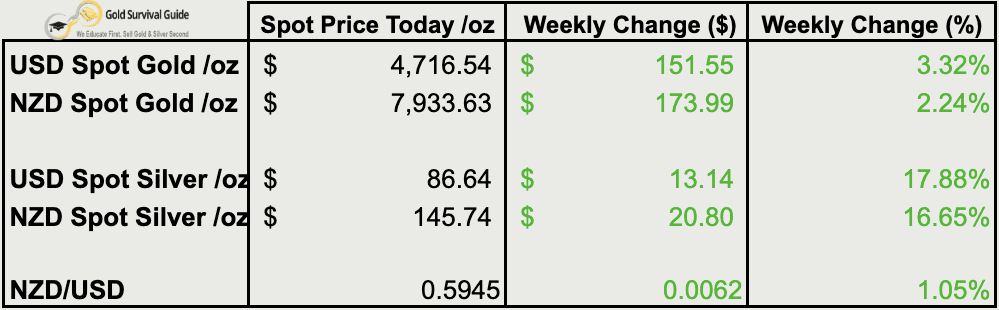
Weekly Price Overview – 13 May 2026
Precious metals surged higher this week, led by silver after both metals held key long-term support levels.
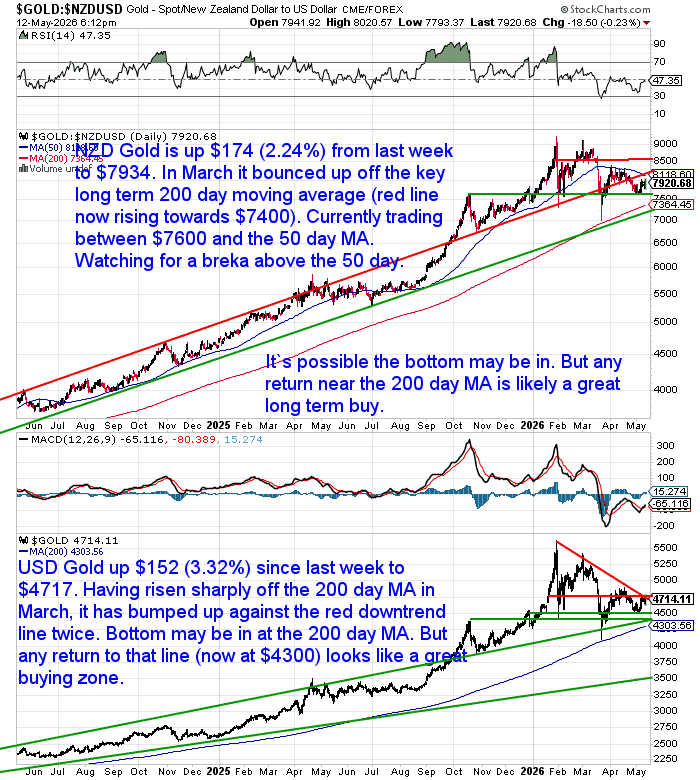
🟡 NZD gold rose $174 (+2.24%) to $7,934
NZD gold rebounded after holding above the rising 200-day MA near $7,400 in March. It’s now trading between $7,600 and the 50-day MA. A break above the 50-day MA would likely signal further upside.
USD gold gained $152 (+3.32%) to $4,717
USD gold continued rebounding after holding the 200-day MA near $4,300 in March.The bottom may already be in near the 200-day MA, with that area still looking like strong long-term support.
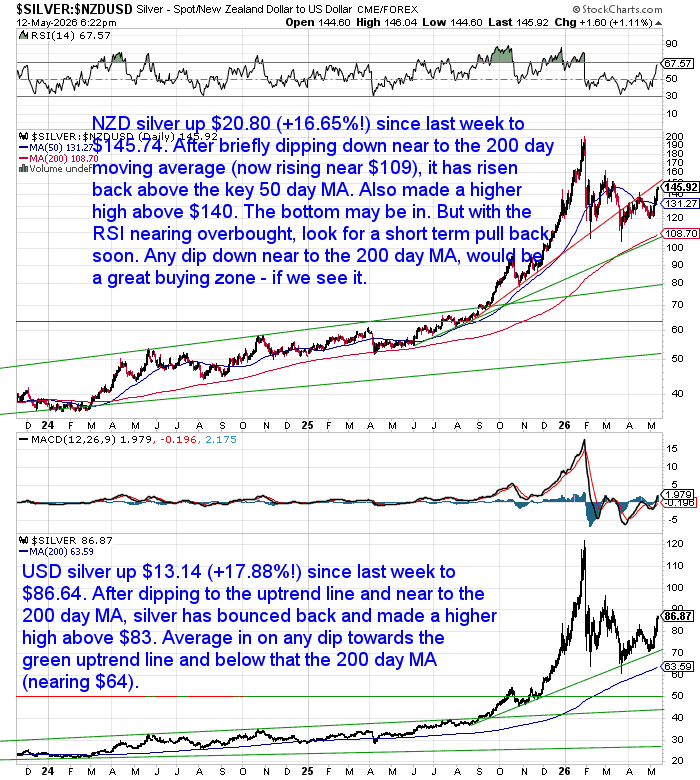
⚪ NZD silver jumped $20.80 (+16.65%) to $145.74
NZD silver rallied strongly after briefly dipping near the rising 200-day MA around $109. It has reclaimed the 50-day MA and made a higher high above $140. RSI is nearing overbought levels, so some short-term consolidation would not be surprising. Any dip toward the 200-day MA would likely remain a strong accumulation zone.
USD silver surged $13.14 (+17.88%) to $86.64
USD silver rebounded after testing the uptrend line and 200-day MA near $64. It has since broken above $83 and made a fresh higher high. Silver is becoming stretched short term after the sharp rally.
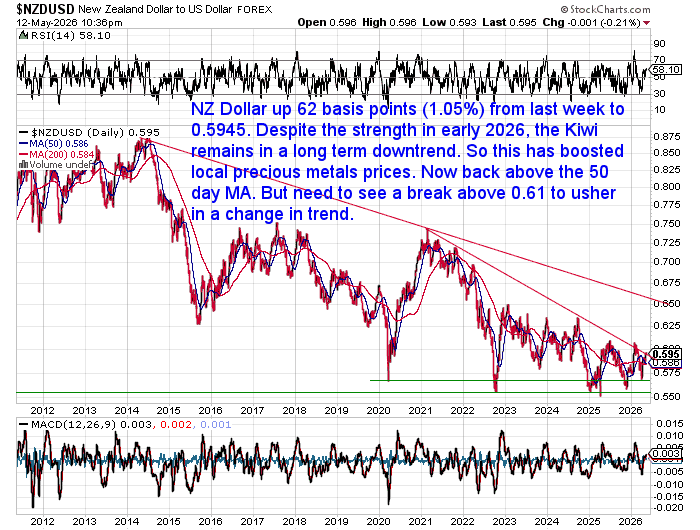
💱 NZD/USD rose 62 basis points (+1.05%) to 0.5945
The Kiwi dollar strengthened this week but remains in a broader downtrend. That continues supporting NZD precious metals prices. NZD/USD is now back above the 50-day MA, though a sustained move above 0.61 is still needed to confirm a trend reversal.
What Type of Gold Bar Should I Buy in 2026?
One of the most common questions we receive is which gold bar is best to buy?
In this updated guide we break down:
- The best gold bar sizes for beginners vs larger investors
- The pros and cons of cast vs minted bars
- Which brands are most recognised worldwide
- And why many experienced investors prefer lower-premium bars
Read the full guide here:
What Type of Gold Bar Should I Buy in 2026?

Does Gold Seasonality Affect the NZ Dollar Gold Price?
You’ve probably heard the saying:
“Sell in May and go away.”
But does gold really follow seasonal patterns?
And more importantly — does that also apply to New Zealand dollar gold prices?
For Kiwi investors, the answer is more complicated because the NZ dollar can dramatically change how gold performs locally.
In this new guide we cover:
- What gold seasonality actually means
- Why gold often performs better later in the year
- How NZ dollar movements change the pattern
- And what 21 years of NZ gold price data reveals
Read the full article here:
Does Gold Seasonality Affect the NZ Dollar Gold Price?
If you’re waiting for a “better time” to buy gold, this article is worth reading first.

Currency Supply Growth Continues
Last week we looked at how individual countries continue expanding currency supply despite the inflation surge of recent years.
This week, another chart from macro analyst Tavi Costa highlights just how significant that growth has become globally.
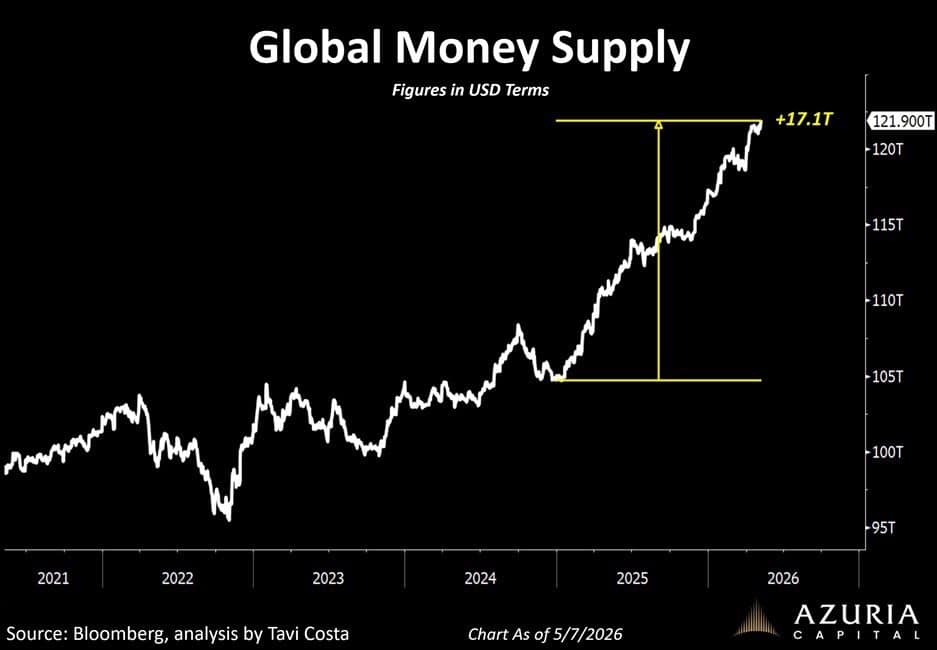
Costa notes:
“Global money supply surged by $17T in the last 2 years.
War is not the only driver of inflation.
Policymakers have been pouring liquidity into the system the entire time.”
Precious metals have historically performed well when currency supply expands rapidly.
At the same time, US inflation data came in hotter than expected again this week.
ASB reported:
“US CPI advanced 0.6% m/m over April. This takes annual inflation to 3.8% – its highest since 2023. Core (ex-food and energy) increased to 2.8%. The results overcooked expectations.”
Lobo Tiggre added:
“[New Fed Chair] Warsh is gonna have fun in the hot seat…”
We wouldn’t say these inflation figures alone caused silver’s latest move higher.
But they likely strengthen the case for holding hard assets while governments continue expanding currency supply.
Silver Appears to be Breaking Higher
Silver has now rebounded strongly after several volatile months of consolidation.
This chart from Tavi Costa suggests silver may now be breaking out of the large consolidation pattern that formed after January’s sharp rally.
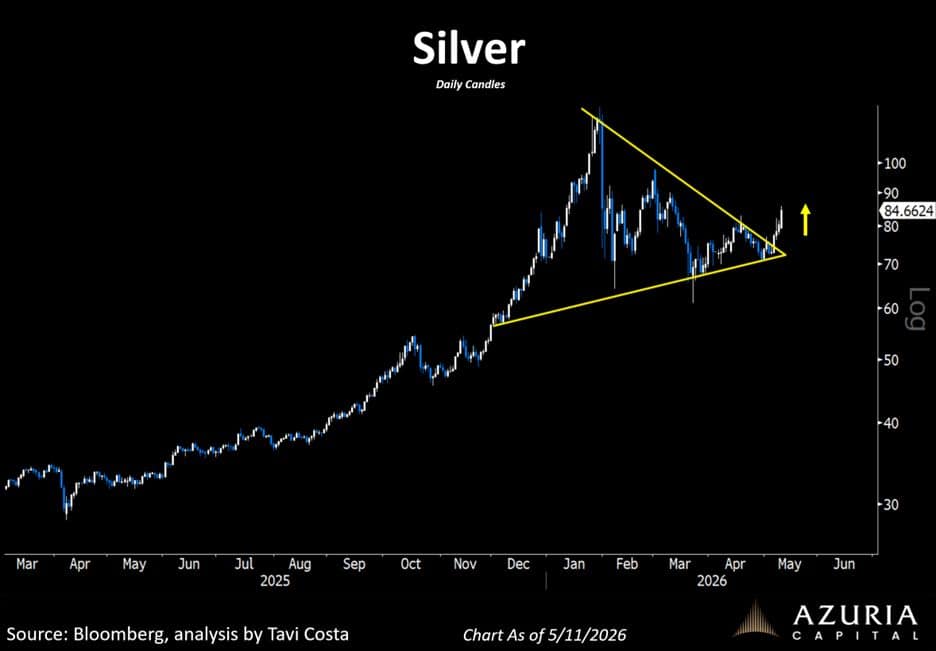
Costa commented:
“Commodities never peak when structural demand is rising while both current and future supply remain heavily constrained.”
Silver supply also remains constrained, while industrial demand continues growing from areas like solar, electrification and AI infrastructure.
That helps explain why silver has remained resilient despite several sharp pullbacks this year.
Silver Still Strong Across Global Currencies
One important point from the In Gold We Trust report is that silver’s strength is global.
Silver has risen this year across almost every major global currency.
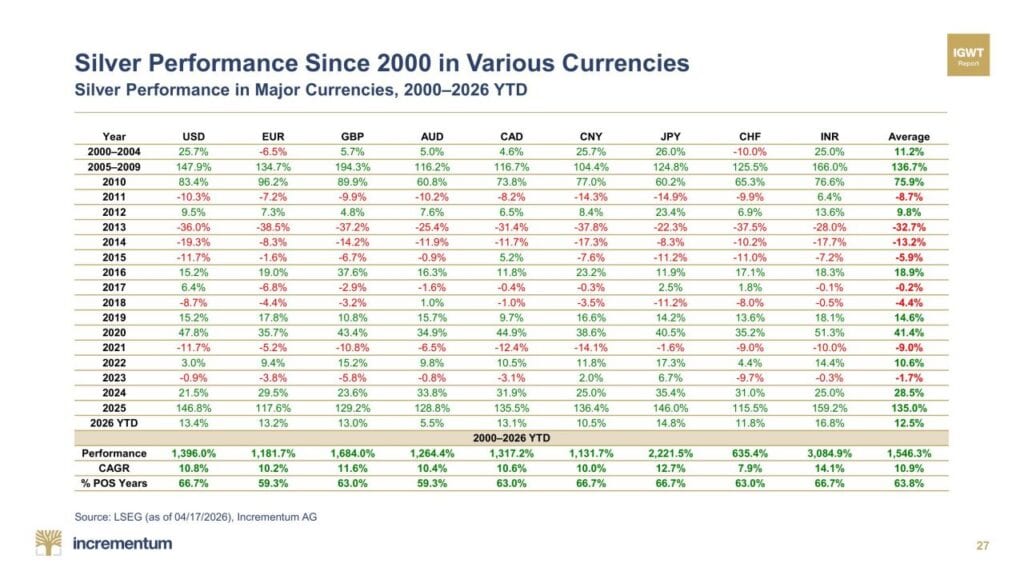
Source: In Gold We Trust Report
As of mid-April:
- Silver in USD was up 13.4% YTD
- Average gains across major currencies were 12.5% YTD
(Interestingly, silver is still lagging gold’s long-term performance.)
This is not simply a weak US dollar story.
Instead, it points to broader concerns around inflation and currency debasement. And a growing investor interest in hard assets
The report also noted an important feature of secular bull markets:
Pullbacks remain sharp, but recoveries are becoming faster.
That describes silver so far this year.
Silver remains volatile.
But long-term investors have historically been rewarded for tolerating that volatility.
But Silver Still Looks Cheap Relative to Financial Assets
Even after the recent rally, silver still looks historically cheap relative to financial assets.
This chart shows silver remains near multi-decade lows relative to the S&P 500.
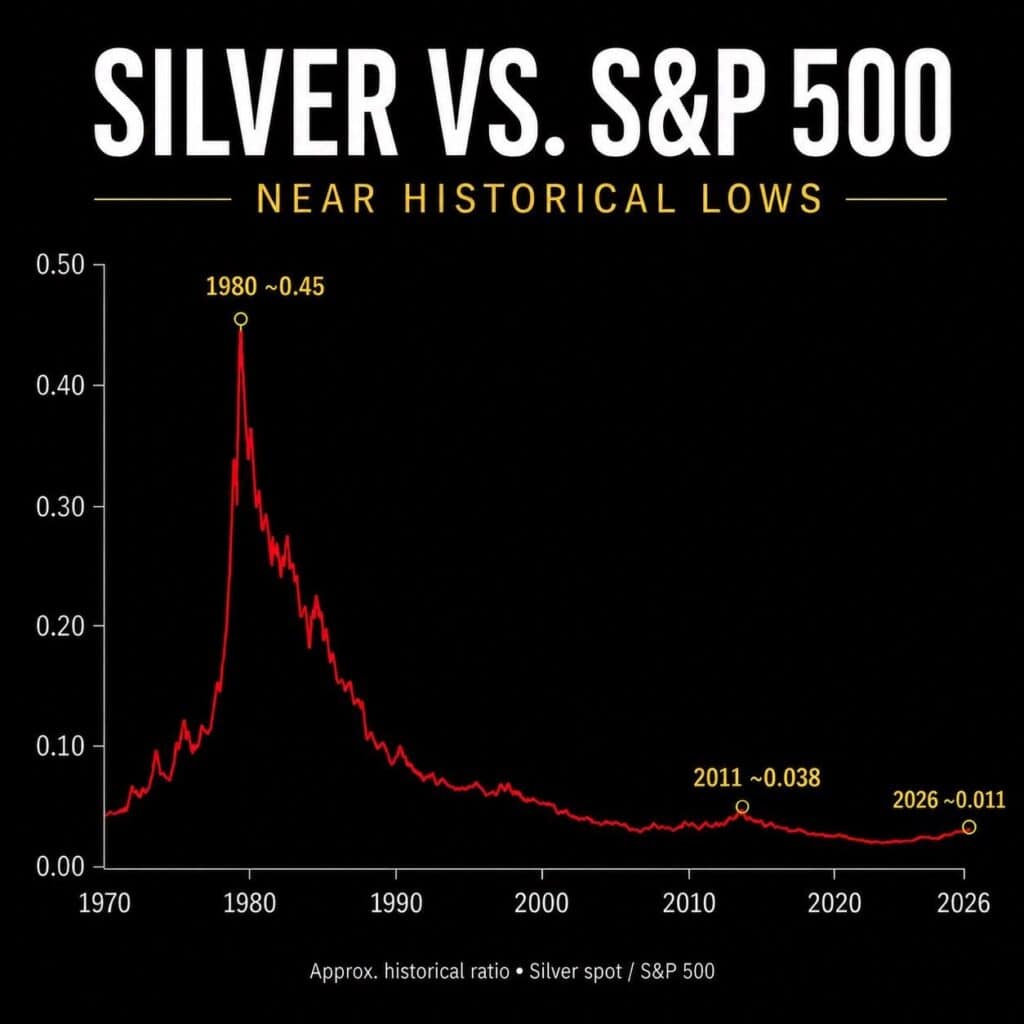
Source: Jaime Carrasco
In simple terms, stocks still look expensive relative to silver by historical standards.
Back in 1980, silver briefly reached almost half the value of the S&P 500 index.
Today that ratio sits near 0.011.
That does not mean silver must repeat the moves of the late 1970s.
But it does show how out of favour precious metals still are after decades of money flowing into stocks and property.
If confidence in financial assets weakens, silver could still have substantial upside relative to equities.
Now may be a good time to review your precious metals allocation — feel free to contact us below for a quote or to discuss the market further.

Glenn's dedication to educating individuals on wealth protection through precious metals has helped over 2400 clients from New Zealand, Australia, USA and Europe to safeguard their financial futures. Passionate about financial independence and lifestyle freedom, Glenn’s mission is to empower others with the knowledge and tools to thrive in today’s volatile economic environment. When he's not advising on precious metals, Glenn enjoys spending time with his family and pursuing outdoor adventures.
Education: University of Auckland Bachelor of Science
Linkedin: https://www.linkedin.com/in/glenn-thomas-0984a4310/
- The Best Time to Buy Gold Is Before You Need It - May 14, 2026
- Silver Breaking Higher as Inflation Heats Up Again - May 13, 2026
- Does Gold Seasonality Affect the NZ Dollar Gold Price? - May 12, 2026