
GSG Weekly Market Wrap – 7 May 2025
This Week:
- GSG Weekly Market Wrap – 7 May 2025
- Weekly Price Overview – 7 May 2025
- Is the Bull Market Already Over — or Just Breathing?
- Mainstream Eyes Still on Gold – Even the Banks Are Watching
- Stagflation: A Theme We Flagged Over a Decade Ago
- Chart of the Wee k: Gold’s Share of Global Equity and Bond Securities
- Meme of the Week: Don’t Wait for the Crowd!
Estimated reading time: 5 minutes
Weekly Price Overview – 7 May 2025
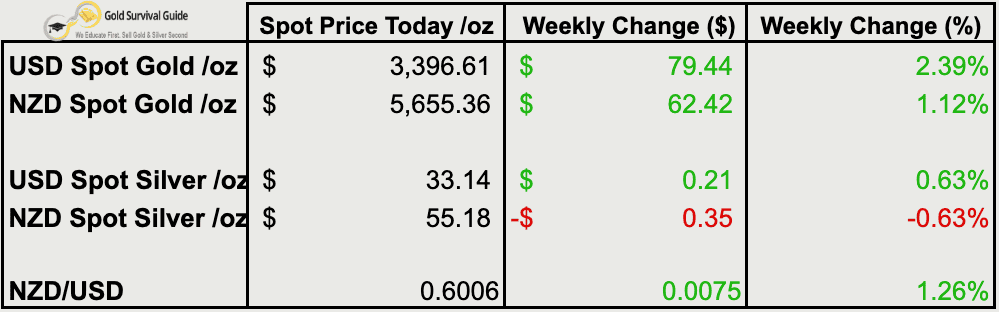
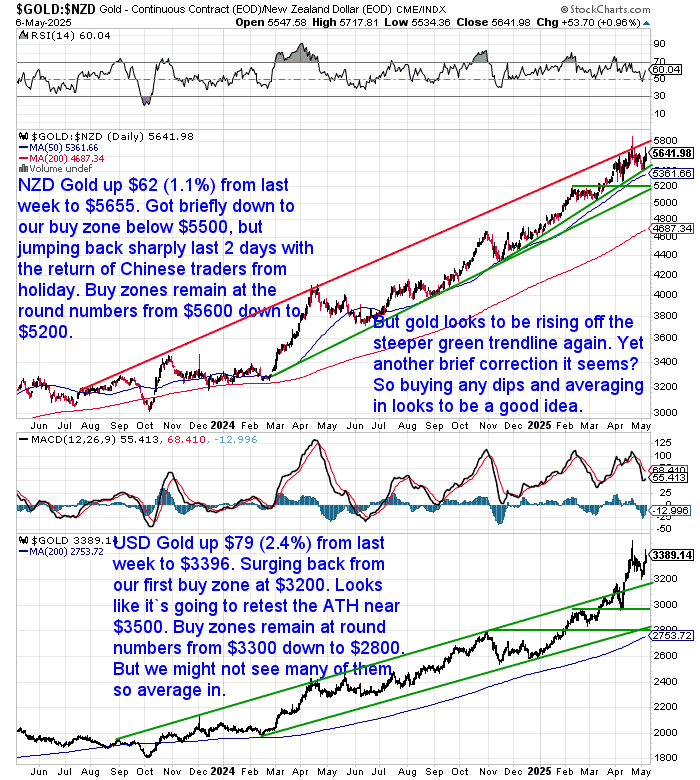
Gold came roaring back this week — with USD gold jumping 2.4% and NZD gold up 1.1%. Prices bounced off key technical levels, just as Chinese traders returned after the May Day holidays. In fact, our latest feature article “Gold Correction 2025: Why This Dip Isn’t the End of the Bull Market” may already need a footnote! Gold has rallied sharply since publication, reinforcing the article’s thesis that the recent dip was more reset than reversal.
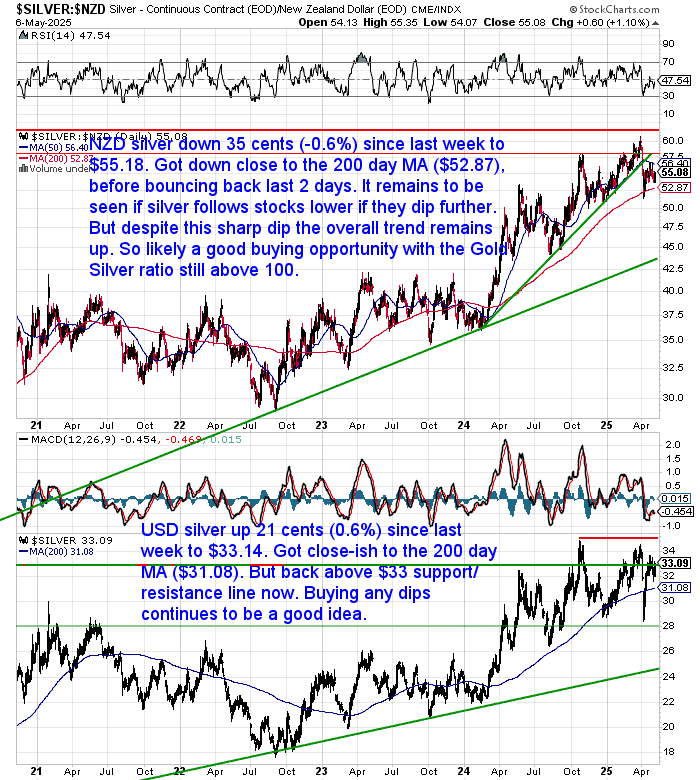
Silver was more subdued. USD silver nudged higher, while NZD silver slipped slightly. But with the gold-silver ratio still elevated, silver continues to look undervalued — and any dips remain potential opportunities.
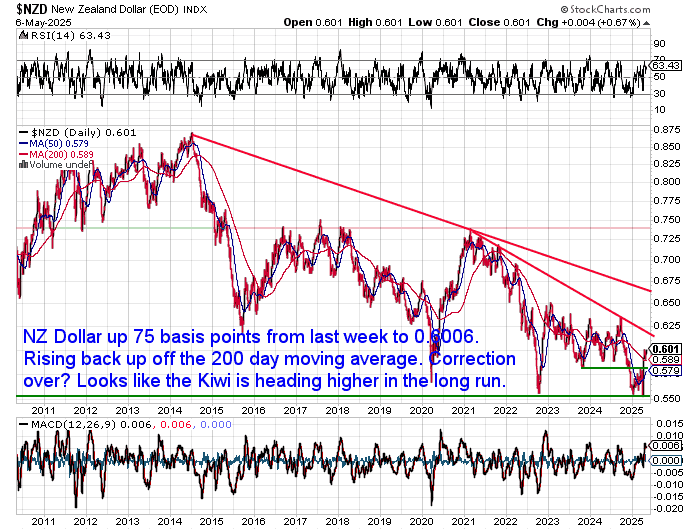
Meanwhile, the NZ dollar rose 75 basis points to 0.6006 — bouncing off its 200-day moving average and possibly signaling a longer-term uptrend.
Is the Bull Market Already Over — or Just Breathing?
After a historic run in Q1, gold has finally pulled back. But is this just a healthy reset… or the start of something more serious?
In this week’s featured article, we look at:
- The key technical levels that gold just bounced from
- What Asia’s buyers and global charts are still signaling
- Why this dip may be normal — and what to watch next
📊 Gold Correction 2025: Why This Dip Isn’t the End of the Bull Market
👉 Read now
Mainstream Eyes Still on Gold – Even the Banks Are Watching
Last week, we noted that gold was finally getting some mainstream airtime — with even ASB giving it a mention in their daily alert. Here’s our full commentary.
Well, they’ve done it again this week:
“Gold prices continue to surge. Spot prices ticked up still by about 2.4%, settling above US$3400 per ounce. Trump’s volatile trade strategy reinforces gold’s status as a haven, with the weaker USD making the metal cheaper for buyers in other currencies.”
Looks like the banks might be warming up to gold commentary after all. Perhaps soon they’ll be updating clients before it moves?!!
Stagflation: A Theme We Flagged Over a Decade Ago
Sticking with ASB, it also seems they’re coming around to our view on the broader macro picture too. Their latest headline?
“ASB Daily Alert: Stagflation is back baby”
Their analysis points to shrinking US GDP, weak Chinese data, and the inflationary risk of new tariffs. Sound familiar?
We’ve been highlighting the risk of a stagflationary endgame for over a decade — first back in 2012, and in more depth again in 2018.
An environment of low growth and persistent inflation still seems the most likely path from here. Central banks may be reluctant to admit it, commercial banks may be slow to catch on, but the signs are growing harder to ignore.
Chart of the Week: Gold’s Share of Global Equity and Bond Securities
Gold still makes up just 1.41% of global financial assets — barely back to 2012 levels, and miles from its 1980 peak.
🟡 What happens if the world starts rebalancing even slightly toward hard assets?
Don’t wait for the herd.

Meme of the Week: Don’t Wait for the Crowd!
Hat tip to Mike Maloney for this…
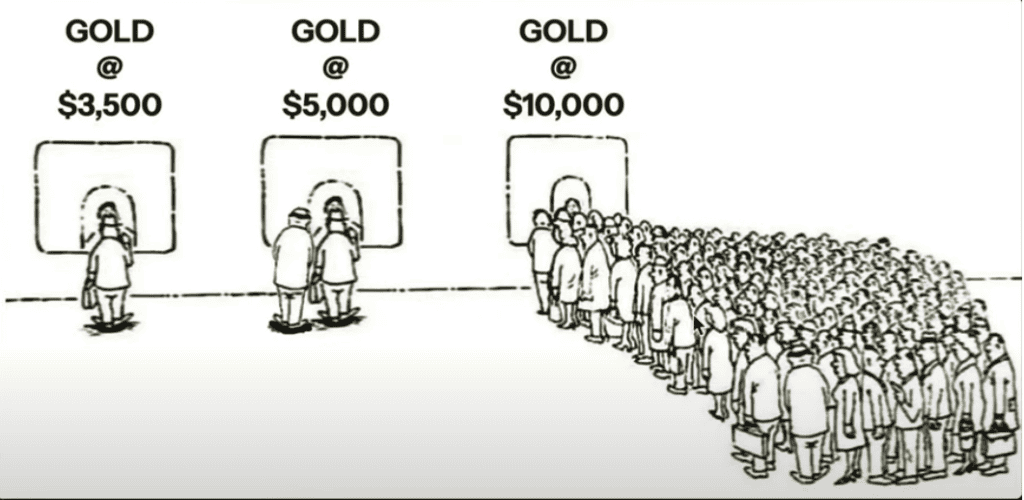
Gold may have pulled back, but as this meme shows — most buyers only show up after the price has already soared.
If you’re thinking about buying, history suggests: it’s better to act before the herd arrives.
📞 Talk to us today or learn more about how to buy gold and silver before prices run away from you.

Glenn's dedication to educating individuals on wealth protection through precious metals has helped over 2400 clients from New Zealand, Australia, USA and Europe to safeguard their financial futures. Passionate about financial independence and lifestyle freedom, Glenn’s mission is to empower others with the knowledge and tools to thrive in today’s volatile economic environment. When he's not advising on precious metals, Glenn enjoys spending time with his family and pursuing outdoor adventures.
Education: University of Auckland Bachelor of Science
Linkedin: https://www.linkedin.com/in/glenn-thomas-0984a4310/
- If/When the US Dollar Collapses, What Will Gold (and Silver) be Priced in? - July 14, 2026
- Central Banks Continue Building Their Gold Reserves - July 8, 2026
- Could New Zealand Rebuild Its Gold Reserves? - July 7, 2026