
This Week:
Estimated reading time: 6 minutes
Weekly Price Overview – 29 Jul 2026
Precious metals pulled back this week after last week’s rebound, giving back those gains while again testing key support levels. Gold and silver remain near long-term buying zones, so averaging in continues to look sensible.
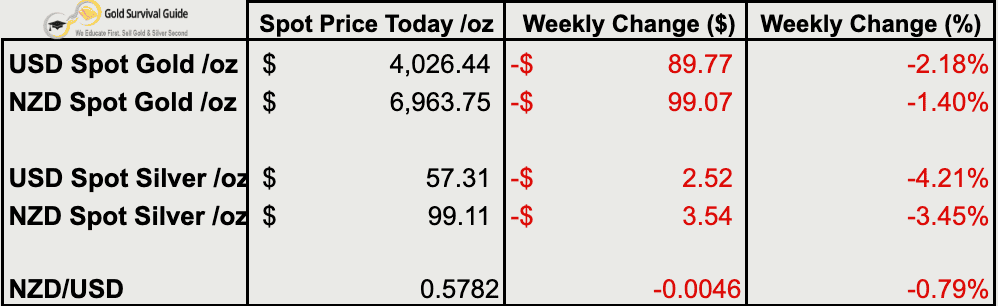
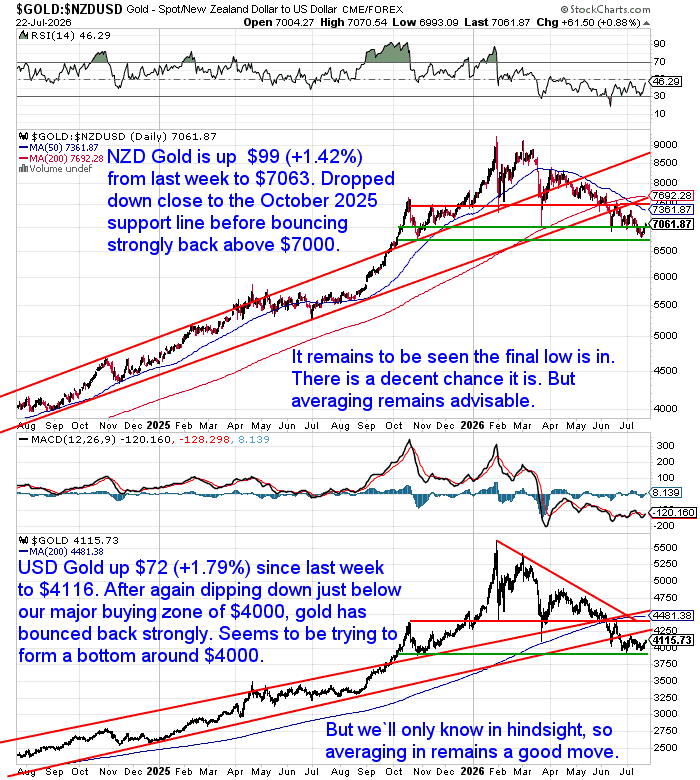
🟡 NZD gold fell $99 (-1.40%) to $6,964
NZD gold gave up last week’s gains, falling back to the October 2025 support level. It remains to be seen whether the final low is in, but averaging in still looks sensible.
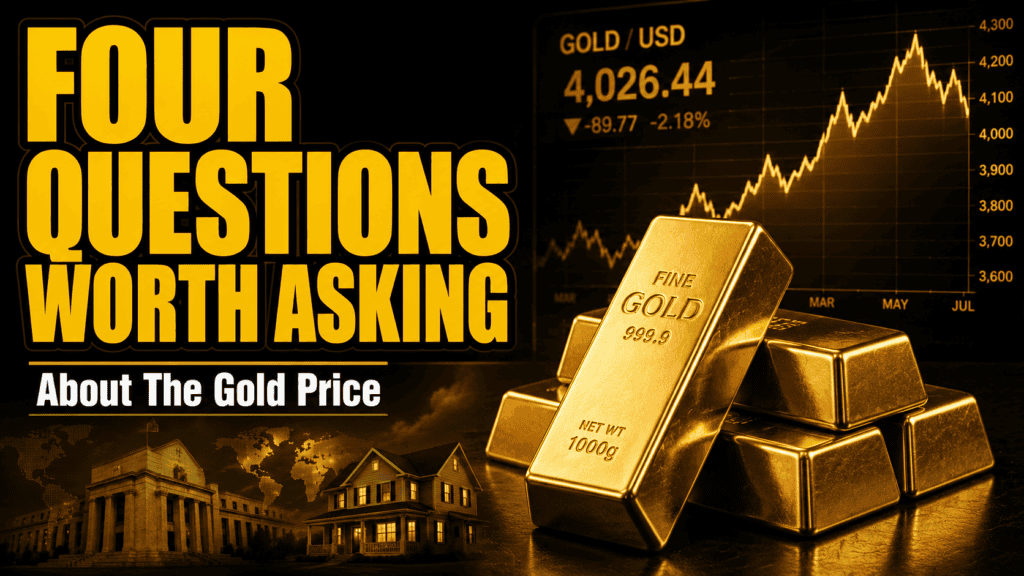
USD gold fell $90 (-2.18%) to $4,026
USD gold briefly dipped below the major $4,000 buying zone before bouncing back strongly. It still appears to be forming a bottom around this level, although that will only be clear in hindsight.
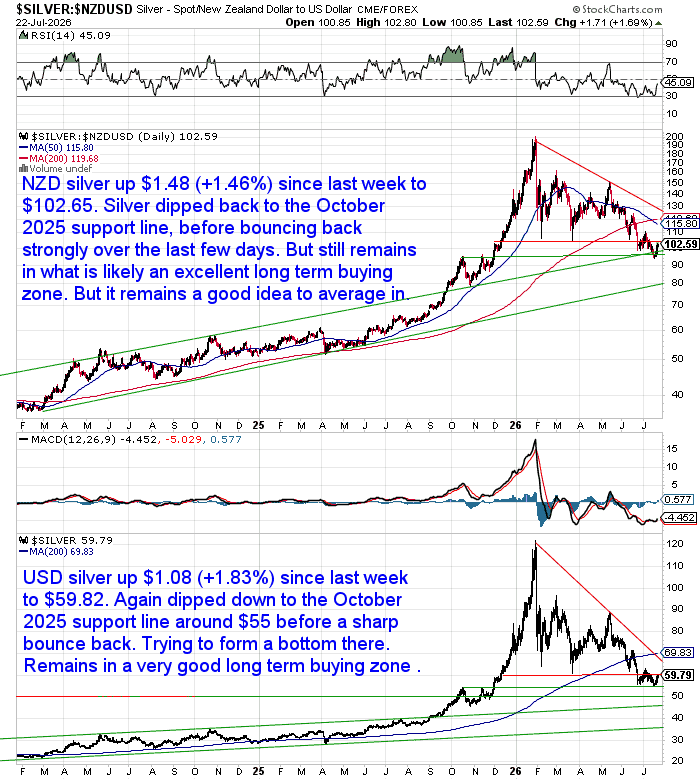
⚪ NZD silver fell $3.54 (-3.45%) to $99.11
NZD silver pulled back below $100 after retesting the October 2025 support area. It remains in a very good long-term buying zone, with averaging in continuing to make sense.
USD silver fell $2.52 (-4.21%) to $57.31
USD silver also pulled back after retesting support around $55. It remains just above this key level and continues to represent a very good long-term buying zone.
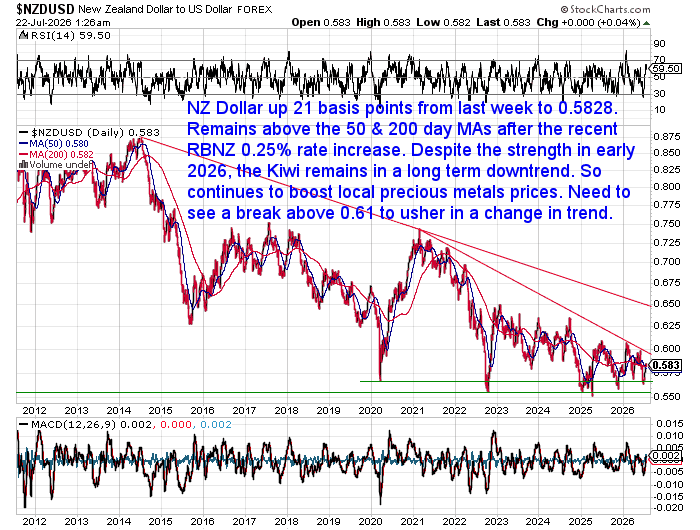
💱 NZD/USD fell 46 basis points (-0.79%) to 0.5782
The Kiwi dollar slipped back below its 50-day moving average but remains in a longer-term downtrend. This continues to support local precious metals prices.
The recent correction in gold and silver has continued to dominate market commentary. Some analysts point to real interest rates, others to technical chart patterns, while some believe the pullback is simply a healthy pause within a longer-term bull market.
Nobody knows exactly where the current correction will end. But history reminds us that major bull markets rarely move in a straight line. Rather than trying to pick the exact bottom, averaging into physical gold and silver during periods of weakness continues to make sense.
Has Fort Knox Ever Been Properly Audited?
Fort Knox is said to hold around half of America’s official gold reserves, yet one question has lingered for decades: has every gold bar ever been independently audited?
Recent comments from the U.S. Treasury have reignited the debate, but the answer is more nuanced than many headlines suggest.
In this week’s feature, we separate fact from speculation, examine what has – and hasn’t – been verified, and explain why the issue still matters for gold investors today.
Read: Fort Knox Gold Audit: Has America’s Gold Ever Been Properly Audited?

Why Does Ownership Matter as Much as Price?
One thing stood out to us this week.
Much of the commentary from analysts and investors centred on where gold might go next. Some focused on technical chart patterns. Others pointed to real interest rates, while many argued the recent pullback is simply a normal correction within a longer-term bull market.
Most of those discussions revolve around one question:
Where does the gold price go next?
At the same time, another question deserves just as much attention.
Questions about Fort Knox, growing interest in physical ownership, continued central bank buying, and the difference between paper and physical gold all point towards a different question:
Why does ownership still matter?
For us, it’s the more important discussion.
Predicting next week’s price has always been difficult. Understanding why governments continue holding thousands of tonnes of gold, why central banks continue adding to their reserves, and why investors keep returning to questions of ownership provides a much longer-term perspective.
Markets spend plenty of time debating price.
We prefer to understand why gold still matters.
What Happens When You Measure Wealth in Gold?
One graphic that caught our attention this week came from the latest In Gold We Trust Report.
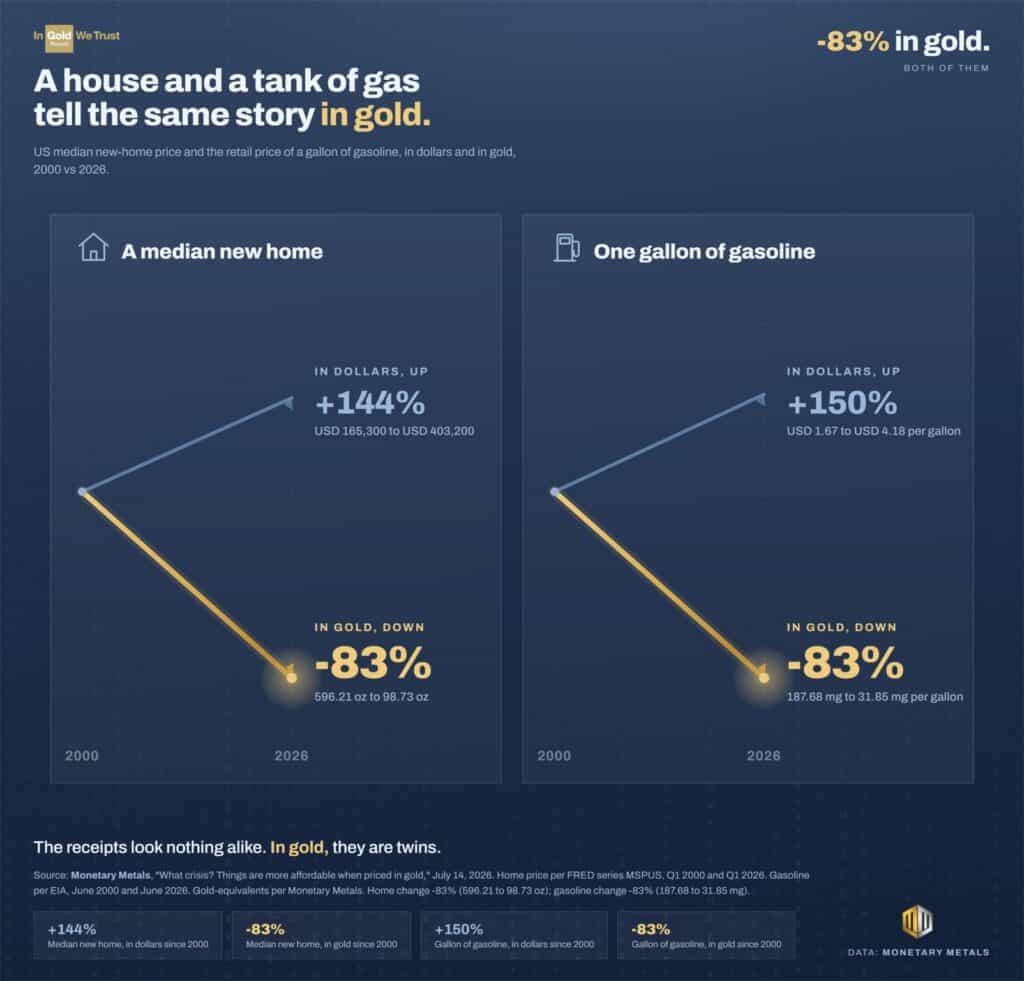
It compared two everyday purchases over the past 25 years: a median US home and a gallon of petrol.
Source: In Gold We Trust Report
Measured in US dollars, both have become dramatically more expensive.
Measured in gold, both require around 83% fewer ounces than they did in 2000.
It’s a useful reminder that the unit you measure wealth in matters.
Most of us instinctively ask how many dollars an ounce of gold is worth.
Sometimes it’s worth turning the question around and asking what those dollars actually buy.
Viewed this way, gold isn’t just another asset. It’s also a useful benchmark for measuring purchasing power over time.
We’ve explored this idea before by looking at how many New Zealand houses an ounce of gold has been able to buy over time. It’s a very different way of thinking about wealth than simply following house prices in dollars.
→ Related reading: NZ Housing to Gold Ratio Update
What Should Long-Term Gold Investors Pay Attention To?
Markets naturally spend a lot of time asking where gold will be next week or next month.
For sure, those questions do matter.
But history suggests the longer-term questions often matter more.
- Why do central banks continue increasing their gold reserves?
- Why are governments once again talking about the gold they already own?
- Why does physical ownership continue to matter in an increasingly digital financial system?
Those questions won’t tell us where gold will trade tomorrow morning.
They may help explain why gold has remained a trusted store of wealth for thousands of years – and why it continues to play an important role today.
If you’d like to discuss building or protecting your precious metals holdings, we’d be happy to help.

Glenn's dedication to educating individuals on wealth protection through precious metals has helped over 2400 clients from New Zealand, Australia, USA and Europe to safeguard their financial futures. Passionate about financial independence and lifestyle freedom, Glenn’s mission is to empower others with the knowledge and tools to thrive in today’s volatile economic environment. When he's not advising on precious metals, Glenn enjoys spending time with his family and pursuing outdoor adventures.
Education: University of Auckland Bachelor of Science
Linkedin: https://www.linkedin.com/in/glenn-thomas-0984a4310/
- When the Crowd Loses Interest, Who Keeps Buying? - August 5, 2026
- If the US Dollar Was Linked to Gold Again, What Would It Mean for New Zealand? - August 3, 2026
- Four Questions Worth Asking Beyond the Gold Price - July 29, 2026
