
Weekly Market Wrap – 18 June 2025
This week:
- Weekly Market Wrap – 18 June 2025
- Weekly Price Overview – 18 June 2025
- What History Says About Gold Prices in Times of Conflict
- OIL’S CRUDE WARNING: Why a 30% Price Spike Could Signal Trouble
- Gold Overtakes the Euro in Global Reserve Rankings
- But Central Banks Say They’ll Keep Buying
- Chart of the Week: Can Fibonacci Predict a $375 Silver Price?
- Meme of the Week: When You Don’t Own Gold and the World Goes Mad…
Estimated reading time: 6 minutes
Weekly Price Overview – 18 June 2025
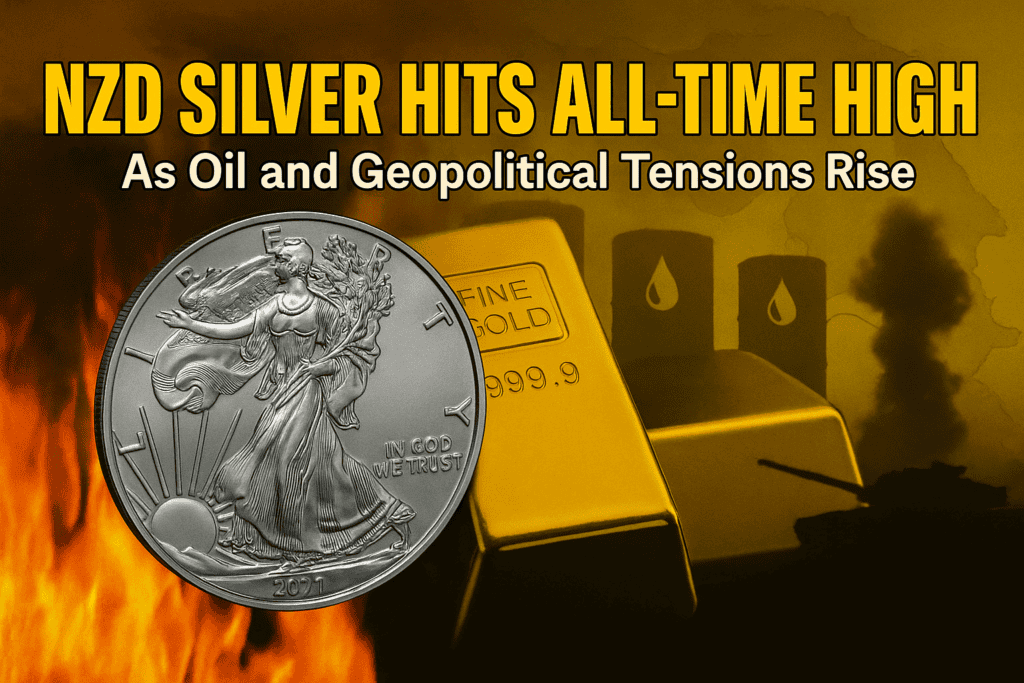
Gold rebounded while silver hit new highs — with both NZD metals breaking out technically.
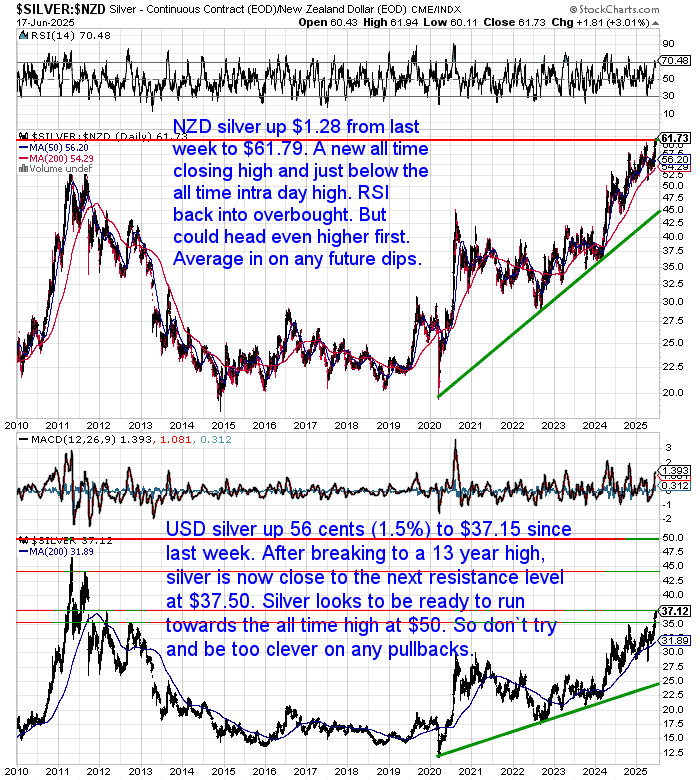
NZD silver hit a new all-time closing high. USD silver is now just $0.35 away from major resistance at $37.50, with momentum clearly on its side.
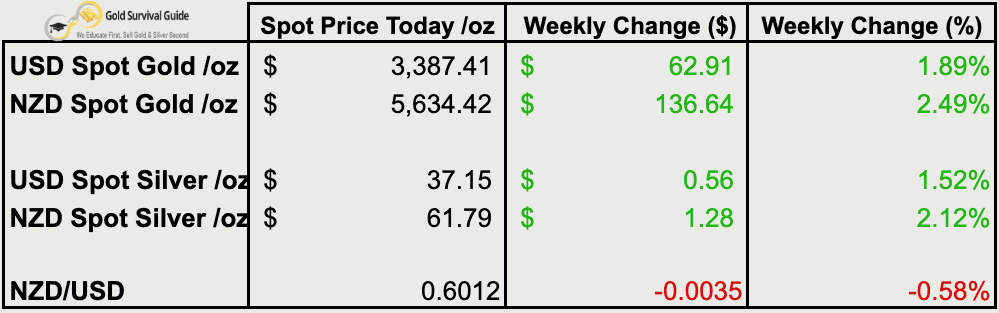
🟡 NZD gold jumped $136.64 to $5,634.42 (+2.49%), breaking above short-term downtrend resistance. USD gold rose $62.91 to $3,387.41 (+1.89%), nearing its all-time high at $3,500. A breakout looks likely if Middle East tensions persist..
⚪ Silver surprisingly strong, given geopolitical ructions. NZD silver gained $1.28 to $61.79 (+2.12%) — its highest close ever. USD silver rose $0.56 to $37.15 (+1.52%), targeting the $50 all-time high. Pullbacks are still buy zones..
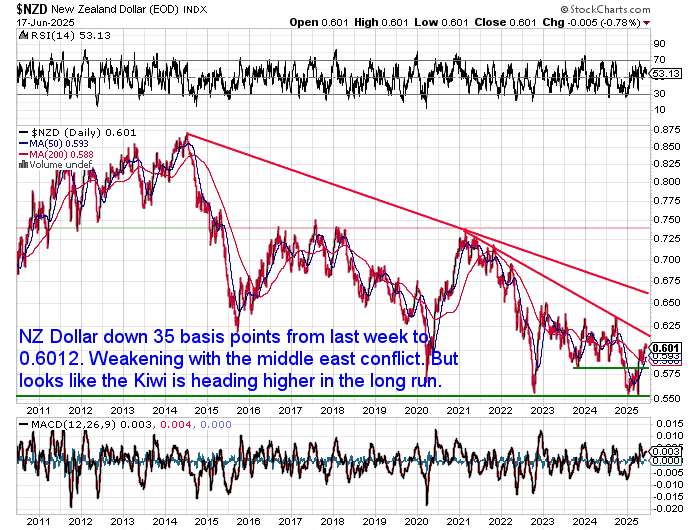
💱 The NZD slipped 0.58% to 0.6012, weakening slightly on Middle East uncertainty. But long-term charts suggest the Kiwi may be turning up from multi-year lows.
📈 Charts confirm silver is leading this bull cycle, with both USD and NZD silver technically strong. Gold is consolidating near resistance — any escalation could spark another leg up. Dips remain opportunities.

What History Says About Gold Prices in Times of Conflict
A week ago we were discussing Ray Dalio’s comments on the potential for civil war in the USA. Just a few days later the headlines have turned to the potential for a larger war. Amid these rising global tensions, many investors instinctively turn to gold. But is it just a knee-jerk reaction — or something deeper? This week’s feature article dives into historical data to uncover how geopolitical conflict impacts precious metals. The answer might surprise you.

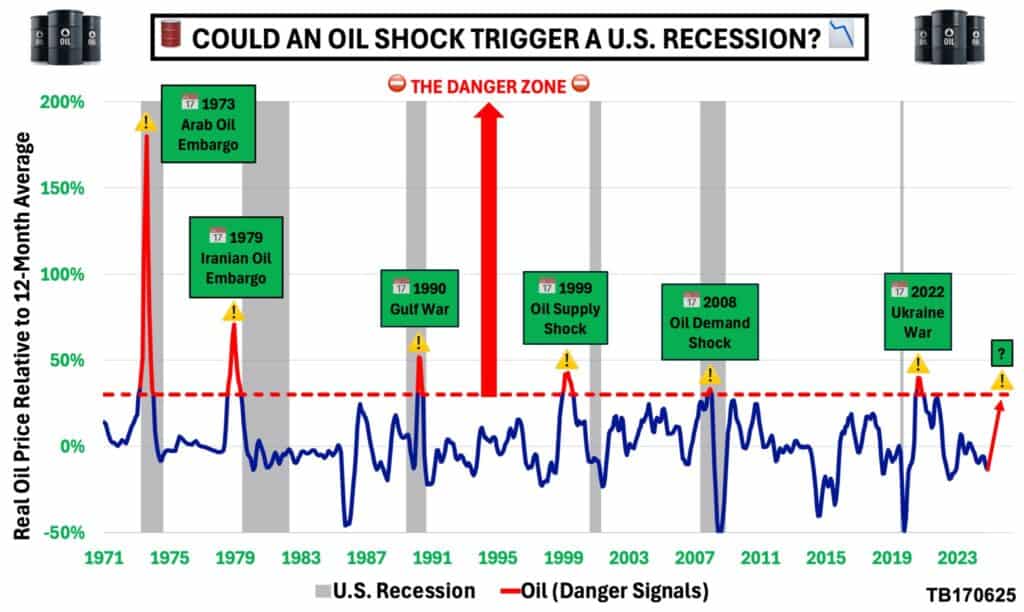
OIL’S CRUDE WARNING: Why a 30% Price Spike Could Signal Trouble
Oil jumped 6% in a single day last Friday — and is now up 30% in a month. With history as our guide, this might not just be a short term blip.
Analyst Tom Bradshaw highlights a consistent pattern: every time oil surges more than 30% above its 12-month average, a U.S. recession has followed — with just one possible exception in 2022.
From the 1973 Arab embargo to the 2008 demand shock, oil spikes this steep have been a reliable recession warning.
Now, with the Israel–Iran conflict, Red Sea disruptions, and potential threats to the Strait of Hormuz, the risks are rising again.
The IMF estimates every 10% jump in oil adds 0.4% to inflation. If oil holds near current levels, we could see another 1.2% inflation surge — just as central banks talk about rate cuts.
“Are we climbing higher with no rope and little oxygen? Without new stimulus, without significant savings, and with inflation risks building—could the next shock push us over the edge?”
— Tom Bradshaw
Full LinkedIn post from Tom Bradshaw →
Gold Overtakes the Euro in Global Reserve Rankings
Last month we highlighted a surprising report from the European Central Bank: Is a Gold Market Shock Brewing? ECB Quietly Flags €1 Trillion in Derivatives Risk. Now an ECB analysis finds that at the end of 2024 gold had surpassed the euro as the world’s second-largest reserve asset.

Source: Bloomberg via ZeroHedge
A recent survey by the World Gold Council [WGC] shows that central banks bought more than a thousand tons per year from 2022 to 2024, more than double the previous decades average.
This puts “their holdings at their highest level since the late 1970s, as measured by weight, and close to the all-time high established in 1965. The current pace of central-bank and sovereign-wealth-fund purchases roughly equals a quarter of mined production.”
But Central Banks Say They’ll Keep Buying
Some argue that with gold hovering near all time highs the pace of buying will slow. However another WGC survey shows that a record 95% of central banks surveyed, believe that official global gold reserves will continue to increase.
Of course all this is based upon “official” central bank numbers. Analysts like Jan Nieuwenhuijs have shown that China likely has much more gold than this. Recently Goldman Sachs and Bloomberg have “borrowed” his analysis on secret gold purchases by the PBoC.
This buying is not likely to stop. When will consumers also join in?
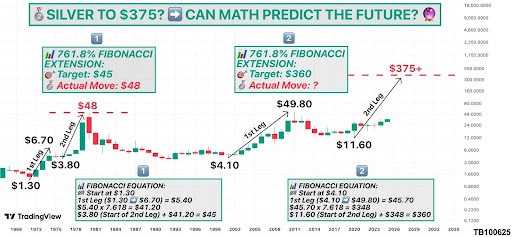
Chart of the Week: Can Fibonacci Predict a $375 Silver Price?
This fascinating chart applies Fibonacci extensions to two major silver bull runs — one from the 1970s and one now in progress. The math predicted a target of $45 in 1980… and silver hit $48.If history repeats, the current setup could project a future silver price of $360–$375+. Far-fetched? Maybe. But the first leg already happened — and the second may be underway.
Meme of the Week: When You Don’t Own Gold and the World Goes Mad…

If you’re worried about your Kiwisaver or other investments turning to mulch, you likely don’t own enough gold and silver!
📞 Talk to us today or learn more about how to buy gold – and especially silver – before the next leg up really gets going.

Glenn's dedication to educating individuals on wealth protection through precious metals has helped over 2400 clients from New Zealand, Australia, USA and Europe to safeguard their financial futures. Passionate about financial independence and lifestyle freedom, Glenn’s mission is to empower others with the knowledge and tools to thrive in today’s volatile economic environment. When he's not advising on precious metals, Glenn enjoys spending time with his family and pursuing outdoor adventures.
Education: University of Auckland Bachelor of Science
Linkedin: https://www.linkedin.com/in/glenn-thomas-0984a4310/
- If/When the US Dollar Collapses, What Will Gold (and Silver) be Priced in? - July 14, 2026
- Central Banks Continue Building Their Gold Reserves - July 8, 2026
- Could New Zealand Rebuild Its Gold Reserves? - July 7, 2026
