
Table of contents
Weekly Price Overview – 10 December 2025
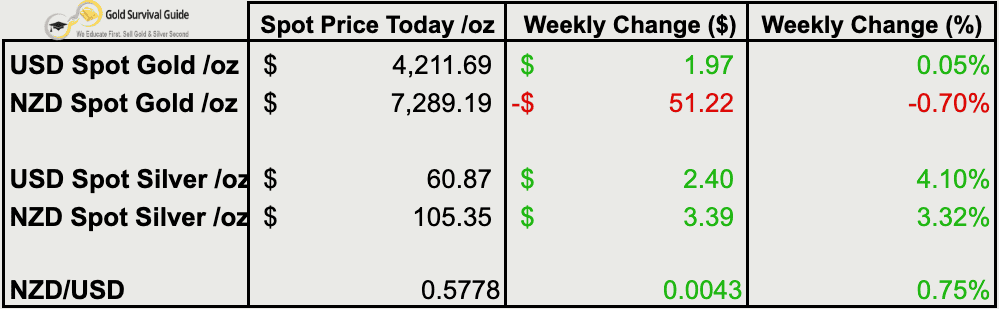
Silver led again, hitting fresh all-time highs in both USD and NZD. Gold was steady in USD but dipped slightly in NZD terms due to a stronger Kiwi dollar. The NZD remains in a long-term downtrend — a continued tailwind for local metals pricing.
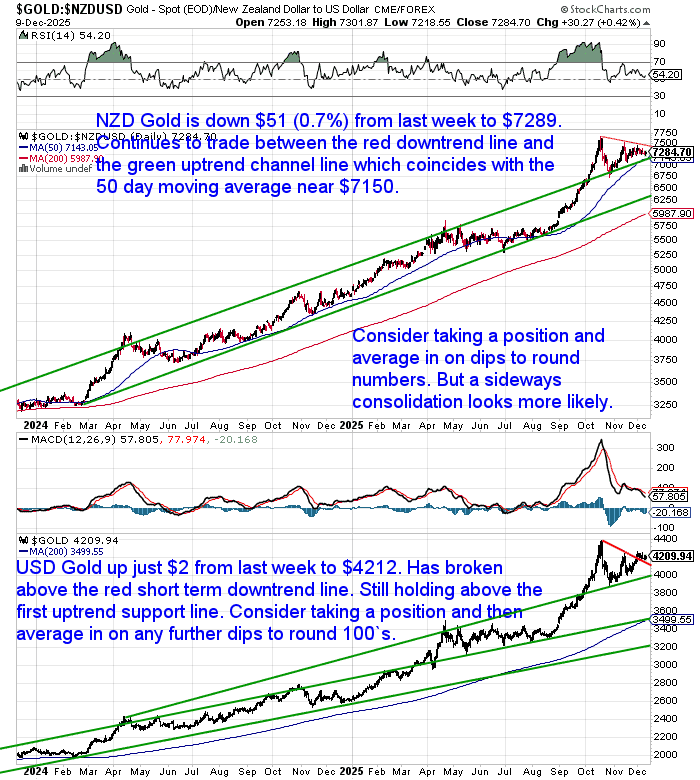
🟡 NZD gold fell $51.22 (-0.70%) to $7,289.19, continuing to trade between its short-term downtrend and long-term uptrend channel. The 50-day moving average near $7,150 remains a key level of support. USD gold edged up $1.97 (+0.05%) to $4,211.69, holding above trendline support with potential for further upside.
⚪ NZD silver rose $3.39 (+3.32%) to $105.35 — another all-time high after a brief pause near $100. Silver remains in a strong uptrend. USD silver jumped $2.40 (+4.10%) to $60.87, clearing $60. Next target: $70. Any pullbacks remain buying opportunities.
💱 NZD/USD gained 43 basis points (+0.75%) to 0.5778. Despite the bounce, The NZD remains in a long-term downtrend, supporting local gold and silver.
📈 Takeaway: Silver’s breakout is holding, and momentum continues to build. Gold is firming, but silver remains the leader. Keep averaging in on dips — especially silver, backed by strong fundamentals.


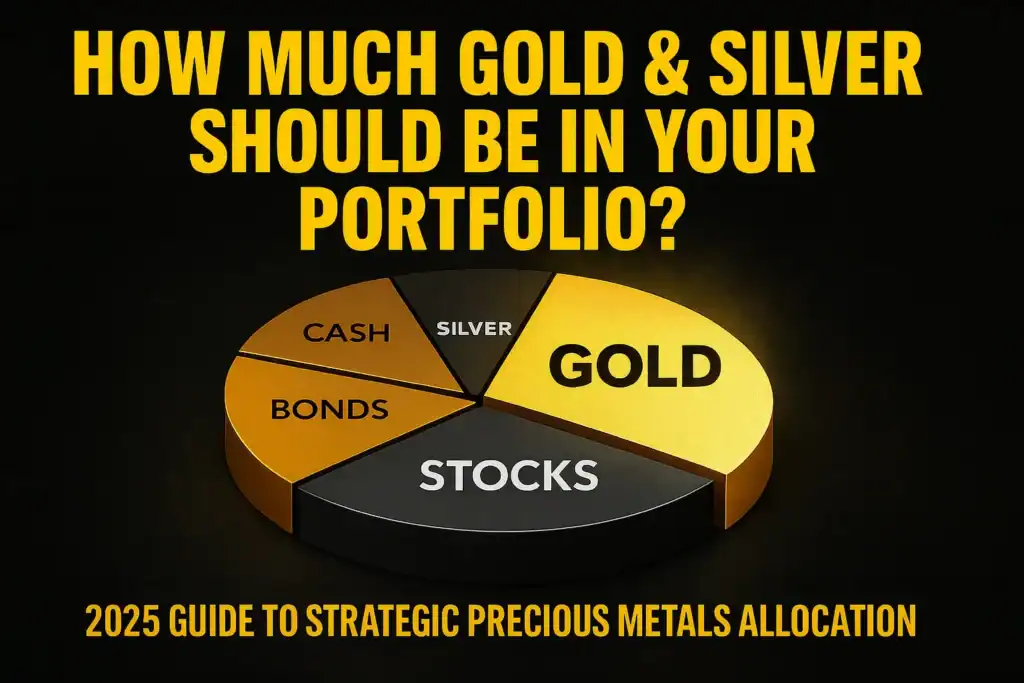
The 2025 Guide: How Much Gold & Silver Do You Really Need?
Finding the right mix of gold and silver in your portfolio isn’t one-size-fits-all. With uncertainty rising, it’s time to reassess. This week’s article breaks down key factors to help you decide how much bullion you might really need — based on your goals, worldview, and risk tolerance.
Don’t miss this guide — especially if you’re just getting started or looking to rebalance as 2025 draws to a close.
How Much Gold and Silver Should Be in Your Portfolio?
BRICS Cross the Rubicon — The “Unit” Goes Live
There’s been a quiet but serious movement on the monetary chessboard: A new gold-backed trade currency is being tested by the BRICS nations (Brazil, Russia, India, China, South Africa). Dubbed the “Unit”, it’s a digital instrument designed to settle international trade — without needing US dollars.
Here’s how it works:
- It’s backed 40% by physical gold, and 60% by the five BRICS currencies (each weighted equally).
- As of October 31, 100 Units were created, each initially worth 1 gram of gold.
- The value floats daily, based on the basket’s performance. By Dec 4, 1 Unit = 0.9823g of gold.
Importantly, this isn’t just theory. In a piece for the Jerusalem Post, trader and analyst Vince Lanci confirmed this “Unit” is now a live pilot program, with serious backing and infrastructure — including blockchain-based payment rails that bypass the traditional SWIFT system. He described the move as the BRICS having “crossed their own Rubicon”, marking a shift from talk to action.
(Source: Jerusalem Post)
What’s different here is not just the gold backing, but the architecture behind it. This isn’t symbolic — it’s a full-fledged, functioning prototype, and it’s drawing attention from other developing nations. If uptake grows, it could institutionalize demand for gold on a scale we haven’t seen since Bretton Woods.
Silver Market: Compression Before Detonation?
While gold plays a starring role in the BRICS trade reset, silver may be stealing the spotlight in the short term — but not for the reasons you’d expect.
This week saw:
- Silver breaking above $60, up nearly 4% in a day
- A major squeeze setup quietly forming under the surface
- Bullion banks scrambling to delay deliveries and defend registered inventories
Vince Lanci and Macro Liquidity both highlighted a building pressure that mirrors past crises – think Hunt Brothers in 1979, the 2011 silver run, or the 2022 LME nickel blow-up. A few key signs:
- 44.2 million ounces of silver have already been stood for delivery in December — that’s 30% of registered COMEX silver.
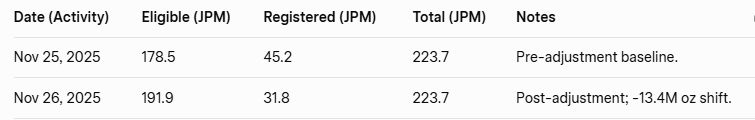
- JPMorgan just reclassified 13.4M oz from “Registered” to “Eligible” — quietly pulling supply off the battlefield.
- The CME briefly halted trading after an unexplained “cooling system issue”… silver exploded +6% when it reopened (as we reported last week).
Sunil Reddy summed it up well:
“This is not stability. It’s compression before detonation.” Source.
The Rolling Problem: Bullion Banks Buying Time
According to Lanci, bullion banks are now rolling their futures contracts and losing money doing it — a major shift. They’re essentially deferring delivery in the hopes that silver will appear from:
- New mining supply
- Scrap sales
- Or disinvestment
But that’s a gamble. With industrial demand from EVs, solar, AI and data centers booming (as noted by the Silver Institute), the market may not be able to meet it. This is shaping up as a slow-motion squeeze, with fewer escape routes every month.
Also this week, India announced that silver can now be used as collateral for loans, encouraging holders not to sell their physical – but to hold and borrow against it instead. That’s a de facto tightening of supply.
Meanwhile, the real issue may not be metal flow — but trust.
Lanci argues that what’s playing out in the London Bullion Market Association (LBMA) is no longer just illiquidity — it’s edging toward structural insolvency. Why? Because delays in delivery (T+60, even T+90) suggest not just tight inventory, but broken supply chains. And in financial markets:
“If you can’t meet your obligations within 90 days, you’re not illiquid — you’re insolvent.”
He continues: even though metal has flowed back into London (as TD Ameritrade’s Daniel Ghali noted), confidence hasn’t. As delivery cracks emerge, counterparties seek alternatives — and trust erodes. That’s what we’re seeing now.
“A refilled vault is no longer enough. What must be repaired now is trust — and trust can’t be restocked overnight.”
In that context, the COMEX restricting registered deliveries and JP Morgan’s reclassification of 13.4M oz of silver from Registered to Eligible looks less like manipulation and more like defensive survival.
Whether or not a full-blown squeeze arrives, the signs are increasingly clear:
- The western paper metals system is under structural stress
- Delivery delays are breaking credibility, not just timelines
- And once trust is lost in the institutions that price and deliver silver — not the metal itself — the market begins looking elsewhere
Chart of the Week: Gold vs S&P 500 — The Long Game
This week’s chart from Tavi Costa is a timely reminder that gold’s recent outperformance may not be an outlier — it may be the start of a multi-decade cycle.
As Tavi notes, we’re now facing a rare mix of:
- The debt levels of the 1940s
- Inflation pressures of the 1970s
- Stock market valuation extremes of the late 1920s and 1990s
If history repeats — or even rhymes — gold may be just getting started.

And if gold is just getting started then silver is still on the warm up track. Get in touch for a quote or with any questions.

Glenn's dedication to educating individuals on wealth protection through precious metals has helped over 2400 clients from New Zealand, Australia, USA and Europe to safeguard their financial futures. Passionate about financial independence and lifestyle freedom, Glenn’s mission is to empower others with the knowledge and tools to thrive in today’s volatile economic environment. When he's not advising on precious metals, Glenn enjoys spending time with his family and pursuing outdoor adventures.
Education: University of Auckland Bachelor of Science
Linkedin: https://www.linkedin.com/in/glenn-thomas-0984a4310/
- Watch What Central Banks Do, Not Just What Governments Say - July 22, 2026
- Gold Revaluation: Why the Debate Is Heating Up Again - July 20, 2026
- How the Centre of Gravity in the Gold Market Is Shifting East - July 15, 2026