

Table of contents
- 📊 Weekly Price Overview – 23 September 2026
- Gold vs Real Interest Rates: What 40 Years of New Zealand Data Shows
- NZ Monetary Policy Review Recommends More Focus on Real Interest Rates
- Gold Demand Is Holding Up Despite High US Real Yields
- China’s Gold Imports Have Hit Record Levels
- Gold Buying in China Versus New Zealand
- Central Banks Continue to Accumulate Gold
- Higher Interest Rates Also Increase Government Debt Costs
Estimated reading time: 9 minutes
📊 Weekly Price Overview – 23 September 2026
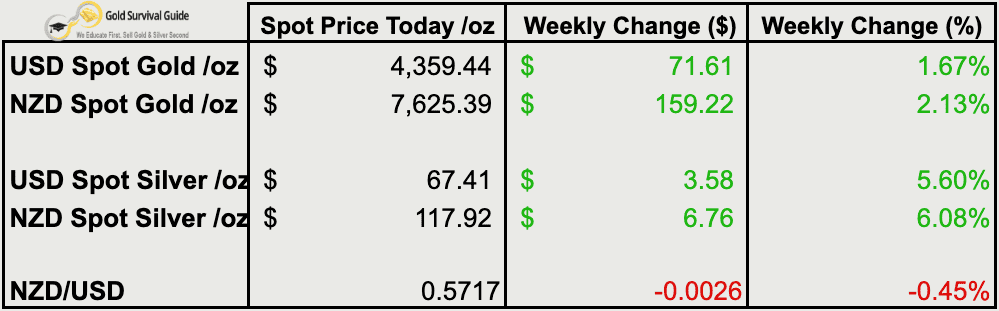
Precious metals rose strongly this week, led by silver. A slightly weaker Kiwi dollar added to the gains in NZ dollar terms.
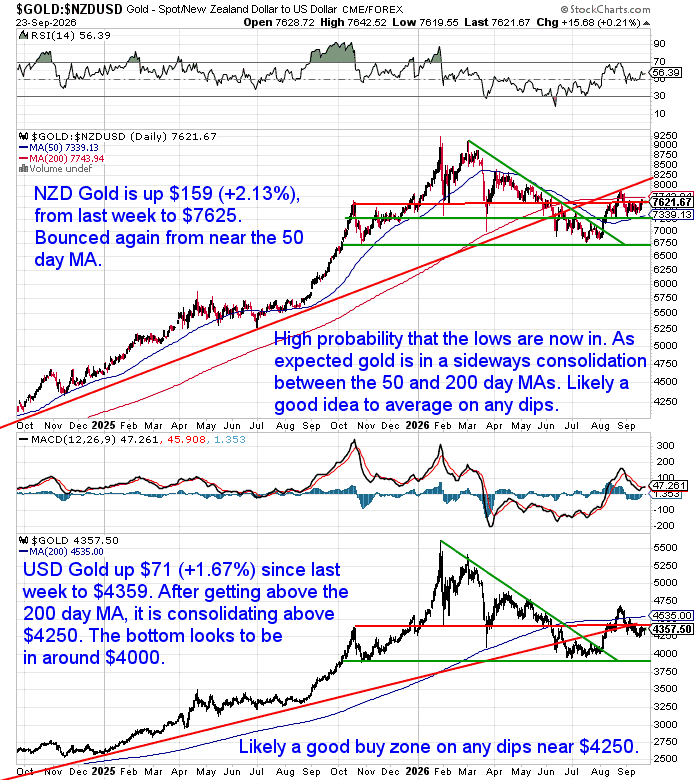
🟡 NZD gold rose $159 (+2.13%) to $7,625
NZD gold bounced again from near its 50-day moving average. It remains in a sideways consolidation between the 50 and 200-day moving averages.
USD gold rose $72 (+1.67%) to $4,359
USD gold is consolidating above $4,250 after moving above its 200-day moving average. The $4,000 area still looks like an important bottom.
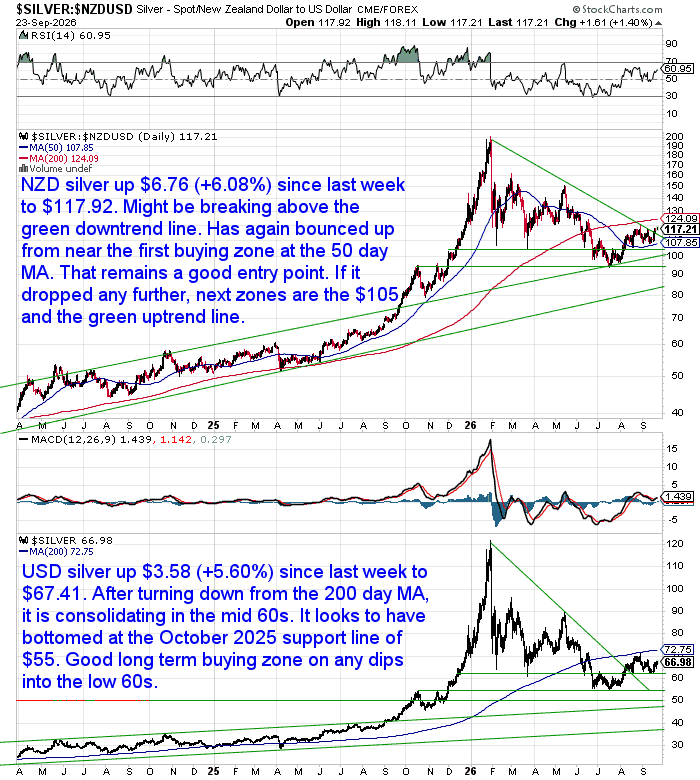
⚪ NZD silver rose $6.76 (+6.08%) to $117.92
NZD silver has bounced again from near its 50-day moving average. It may also be breaking above its recent downtrend.
USD silver rose $3.58 (+5.60%) to $67.41
USD silver is consolidating in the mid-$60s. The low-$60s still look like a potential buying zone on any pullback.
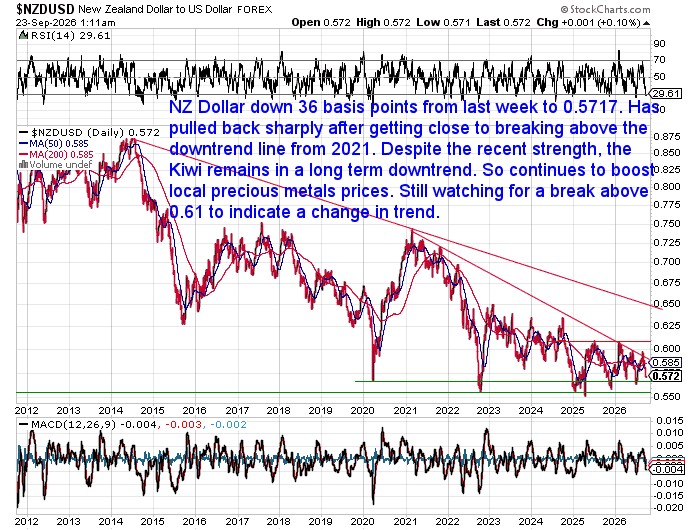
💱 NZD/USD fell 26 basis points (-0.45%) to 0.5717
The Kiwi dollar pulled back after nearing its long-term downtrend line. It remains in a long-term downtrend, with a break above 0.61 still needed to signal a change.
Gold vs Real Interest Rates: What 40 Years of New Zealand Data Shows
You hear plenty about interest rates whenever the Reserve Bank changes the OCR.
But another interest rate may matter much more for gold.
That’s the real interest rate — the return you receive after allowing for inflation.
So we compared more than 40 years of New Zealand real interest rates with the gold price in NZ dollars.
How closely have the two moved together? What happened to gold when real rates were high, falling or negative? And could this tell us anything useful about when to own gold?
The long-term chart reveals some interesting patterns — including one that may surprise you.
Read: Gold vs Real Interest Rates: What 40 Years of New Zealand Data Shows

NZ Monetary Policy Review Recommends More Focus on Real Interest Rates
There was some timely reading from closer to home this week.
A Government-commissioned independent review looked at the Reserve Bank’s monetary policy response during COVID.
The reviewers found the initial response was justified. But as the economy recovered, monetary stimulus remained too strong for too long.
One problem was that inflation was rising faster than the OCR. So even when the Reserve Bank began raising the OCR, the real OCR was still falling.
The chart below shows the difference. The nominal OCR was close to zero through 2020 and 2021. But after allowing for inflation, the real OCR fell to around minus 7%.
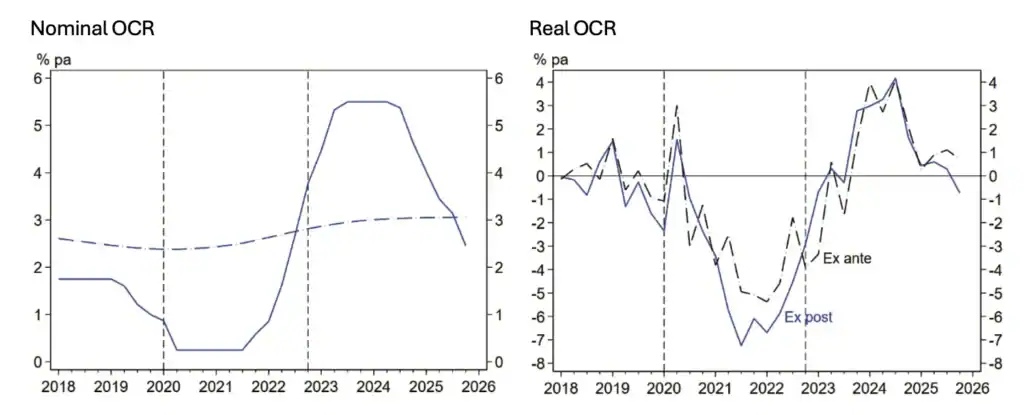
The reviewers called monetary policy “extraordinarily accommodative” around the end of 2021. Their modelling suggests earlier action could have reduced the boom and bust that followed.
One recommendation is particularly relevant to this week’s featured article:
“Greater emphasis should be placed on real interest rates in assessing and communicating the stance of monetary policy.”
They recommend showing the real OCR in future Monetary Policy Statements.
We’d go a step further.
Interest rates are effectively the price of money. Yet our monetary system relies on a small group of people deciding what that price should be.
Those decisions rely on forecasts for inflation, employment and the economy. When those forecasts are wrong, policy can remain too loose or too tight for too long.
Our preference is for the price of money to be set by the market, rather than a committee.
The review proposes ways to improve the current system. But no amount of fine-tuning removes the basic problem: central bankers still have to decide what the right interest rate should be.
Read: Independent Review of the Monetary Policy Response to the COVID-19 Pandemic
Gold Demand Is Holding Up Despite High US Real Yields
New evidence this week shows why real interest rates aren’t telling the whole story for gold.
Ole Hansen, Head of Commodity Strategy at Saxo, noted that the US 10-year real yield reached 2.63% last week. Its highest level in more than 20 years.
Normally, that should create a significant headwind for gold.
Yet gold-backed ETF holdings have been recovering rather than falling.
That’s different from 2022–23, when rising real yields led Western ETF investors to sell gold. Strong central-bank demand helped keep the gold price resilient.
Now ETF demand itself is proving more resilient. Hansen suggests concern about government debt could help explain why. Investors may see high long-term yields as both an attractive return and a sign of greater fiscal risk.
Standard Chartered’s Suki Cooper made a similar observation this week.
Gold’s correlations with 10-year and 30-year real yields are now close to neutral. Gold-backed investment products also recorded inflows of 121 tonnes in August — their strongest month since September 2025.
Both reports support what we found in this week’s featured article. Real yields still matter for gold, but since 2022 they have become a much less reliable guide to its price.
China’s Gold Imports Have Hit Record Levels
The Financial Times reports that China imported more than 1,000 tonnes of gold during the first eight months of 2026.
It spent a record US$158.8 billion on those imports. That’s already well above the US$96.5 billion spent importing 886 tonnes during the whole of 2025. (Source: FT)
This isn’t simply the People’s Bank of China buying more gold for its reserves.
Chinese households and private investors are also buying. Weak property and share markets, along with low bond yields, have increased gold’s appeal as a store of wealth.
Kitco reports that strong investment demand has pushed Chinese gold prices above international prices at times. Zijie Wu of Jinrui Futures said this, along with a stronger yuan, has encouraged wholesalers to import more bullion.
That’s a very different environment from what we’re currently seeing here in New Zealand.
Gold Buying in China Versus New Zealand
Retail demand for physical gold and silver remains very subdued here.
Transaction numbers have fallen sharply as interest from everyday investors has faded.
Despite the low transaction numbers, we’ve continued to see some large bullion purchases.
We’ve seen a similar pattern elsewhere. In early August Chris Weber reported significant buying among wealthy investors in Monaco while US retail demand remained weak.
China’s gold market is vastly larger than New Zealand’s.
China has a deep culture and infrastructure around private gold ownership. One example this week was a Shanghai “gold ATM”. Customers can have gold melted and assessed, then receive the proceeds in their bank account.

Source: Alvin Foo
The machine buys gold from the public, so it isn’t evidence of Chinese consumers buying gold.
But it does show how developed China’s private gold market has become.
Compare that with New Zealand, where owning physical investment gold remains decidedly niche.
Broad retail participation may be quiet, but we’re still seeing some significant purchases from larger New Zealand buyers.
Central Banks Continue to Accumulate Gold
China is also one of the world’s largest official-sector gold buyers.
World Gold Council data shared by Ryan Lemand shows the largest reported official-sector gold buyers since the start of 2022.
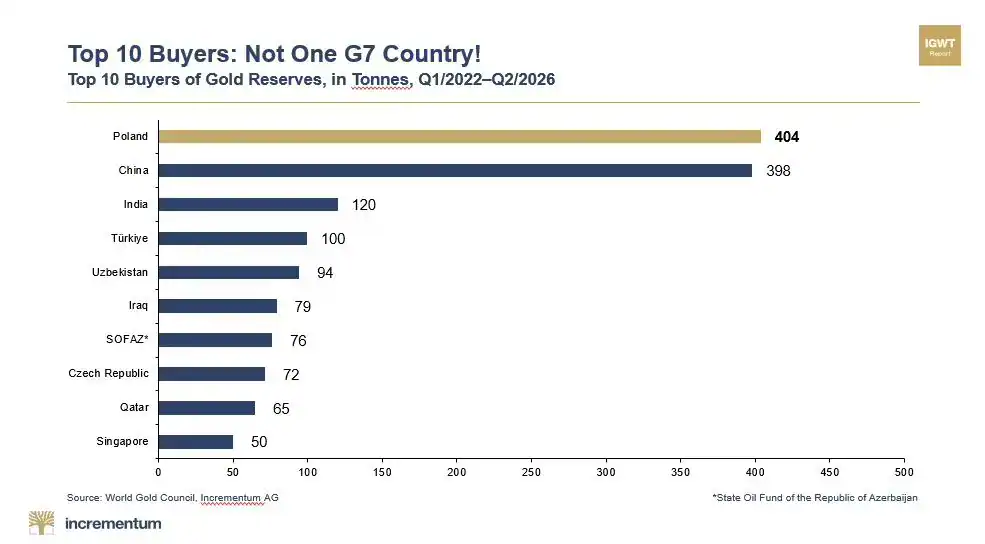
Source: IGWT via Ryan Lemand
Poland and China lead the list, with other significant buyers including India, Türkiye, Uzbekistan, Iraq and Qatar.
Notably, there isn’t a G7 country among the ten largest buyers.
That doesn’t mean G7 countries have rejected gold. The United States, Germany, Italy and France already hold some of the world’s largest gold reserves.
New Zealand is at the opposite end of the spectrum. The Reserve Bank of New Zealand holds no monetary gold reserves.
Read: How Much Gold Does the Reserve Bank of New Zealand Have?
Higher Interest Rates Also Increase Government Debt Costs
Higher interest rates don’t just benefit savers. Governments have to pay them too.
This chart shared by Tavi Costa shows US net interest costs as a share of federal spending.
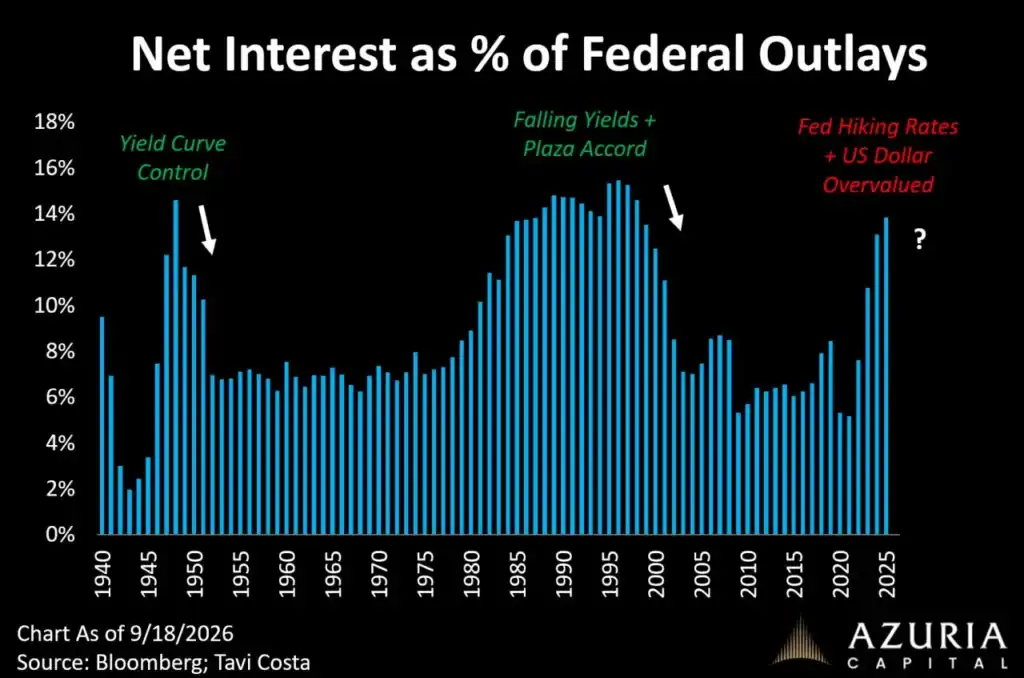
Source: Tavi Costa
Those costs have risen sharply as older government debt is refinanced at higher interest rates.
Costa argues that high rates, a strong US dollar and rising debt costs can’t continue indefinitely.
Higher real yields make bonds more attractive compared with gold. But they also increase government debt costs.
So the same high yields that compete with gold can also raise concerns about the debt behind those bonds.
That may help explain why gold demand is holding up better than its old relationship with real yields would suggest.
If you have any questions about this week’s wrap or precious metals in general, feel free to get in touch.

Glenn's dedication to educating individuals on wealth protection through precious metals has helped over 2400 clients from New Zealand, Australia, USA and Europe to safeguard their financial futures. Passionate about financial independence and lifestyle freedom, Glenn’s mission is to empower others with the knowledge and tools to thrive in today’s volatile economic environment. When he's not advising on precious metals, Glenn enjoys spending time with his family and pursuing outdoor adventures.
Education: University of Auckland Bachelor of Science
Linkedin: https://www.linkedin.com/in/glenn-thomas-0984a4310/
- Record Chinese Gold Imports Despite High Interest Rates - September 23, 2026
- Gold vs Real Interest Rates: What 40 Years of New Zealand Data Shows - September 22, 2026
- Bond Yields Are Rising — Including Here in New Zealand - September 16, 2026
