
Gold, Monetary System
Gold vs Real Interest Rates: What 40 Years of New Zealand Data Shows
Sep
The US Federal Reserve raised interest rates last week for the first time in more than three years.
Gold initially fell by more than 1%. Yet by the following day it was rising again.
If higher interest rates are supposed to be bad for gold, why isn’t the relationship more straightforward?
One reason is that the headline interest rate doesn’t tell us what is happening to the real interest rate — the return left after allowing for inflation.
We’ve been tracking New Zealand real interest rates against the gold price for many years. We’ve now updated our data through to June 2026, giving us more than 40 years to compare.
For much of that period, the traditional relationship is fairly easy to see. When real rates fall, gold tends to perform better. When real rates rise, gold often struggles.
But something unusual happened after 2022.
Real interest rates in New Zealand rose sharply. Gold rose too.
So how useful are real interest rates for understanding the gold price today? And can they still help when deciding when to buy gold?
Real interest rates still matter for gold, but they are not a reliable standalone timing signal.
Historically, gold has tended to perform better when real interest rates are low, negative or falling. However, our updated New Zealand data shows a clear divergence after 2022. Real rates rose sharply between 2022 and 2024, yet the NZ dollar gold price rose with them.
International data shows a similar change. The European Central Bank found that the negative relationship between gold and real yields from 2008 to early 2022 subsequently broke down.
Table of Contents
- Real interest rates still matter for gold, but they are not a reliable standalone timing signal.
- What Are Real Interest Rates?
- Why Do Real Interest Rates Affect Gold?
- Gold vs Real Interest Rates: What Does 40 Years of NZ Data Show?
- What Changed After 2022?
- Do Real Interest Rates Still Matter for Gold?
- Can Real Interest Rates Tell You When to Buy Gold?
- The Bottom Line
- Frequently Asked Questions
What Are Real Interest Rates?
A real interest rate is simply an interest rate adjusted for inflation.
For example, imagine you’re earning 5% interest on your savings while inflation is running at 3%.
Your approximate real interest rate is:
5% − 3% = +2%
You’re earning interest and increasing your purchasing power.
Now suppose your savings still earn 5%, but inflation rises to 7%.
Your real interest rate becomes:
5% − 7% = −2%
Your bank balance may be increasing, but the purchasing power of that money is falling.
A 5% interest rate can therefore provide a healthy real return when inflation is 2%, but a negative real return when inflation is 7%.
How We Calculate New Zealand Real Interest Rates
The interest-rate data comes from the Reserve Bank of New Zealand. Inflation is measured using the annual change in the Consumers Price Index (CPI) from Stats NZ.
We use the overnight interbank rate partly because the RBNZ data gives us a consistent series stretching back to 1985. For this analysis, we’re particularly interested in the direction of real rates over time.
Our measure is a short-term, policy-linked real interest rate. It isn’t the same as the US 10-year real Treasury yield often used in international gold analysis.
For a broader look at what happens to gold when central banks change headline rates, see Gold and Interest Rates: What Rising Rates Mean for Gold Prices.
Why Do Real Interest Rates Affect Gold?
Gold doesn’t pay interest.
That can put it at a disadvantage when cash and bonds offer a good return after inflation.
Imagine cash is earning 6% while inflation is 2%. The saver is receiving a real return of roughly 4%. Holding an asset that pays no interest carries a more obvious opportunity cost.
But suppose cash earns 3% while inflation is running at 5%. The real return is around −2%. In purchasing-power terms, the saver is going backwards.
Gold’s lack of interest then becomes less of a disadvantage.
This gives us the traditional relationship between gold and real interest rates:
Rising real rates tend to create a headwind for gold.
Falling or negative real rates tend to be more supportive of gold.
There have been long periods when the data supports this relationship. But it isn’t a rule.
Gold vs Real Interest Rates: What Does 40 Years of NZ Data Show?
We first published our analysis of New Zealand real interest rates and gold in 2012. We’ve now extended the data through to June 2026.
The chart compares our measure of the NZ real interest rate with the gold price in New Zealand dollars.
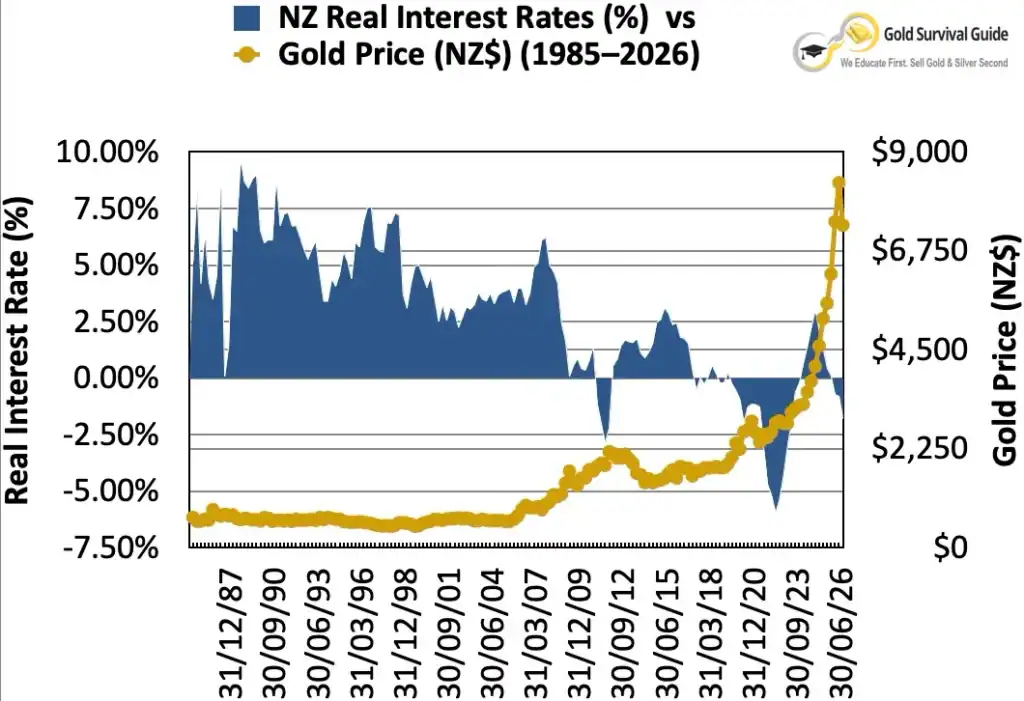
Over the full period, the inverse relationship is visible at times. During much of the 1980s and 1990s, real rates remained relatively high while gold was mostly flat or falling in NZ dollar terms.
A more recent example came after the 2011 gold peak.
When Rising Real Rates Were a Headwind for Gold
Following gold’s 2011 peak, New Zealand real interest rates moved higher.
By 2014, real rates were back in positive territory. At the same time, the NZ dollar gold price was well below its 2011 high.
Higher real returns increased the relative appeal of cash and interest-bearing assets, while gold faced a stronger opportunity-cost headwind.
The relationship wasn’t exact from quarter to quarter. Currency movements and other influences on the NZ dollar gold price were also at work. But over this period, real rates provided useful context.
Then Something Different Happened After 2022
By early 2022, inflation had risen much faster than interest rates, pushing our measure of the NZ real interest rate to almost −6%.
Real rates then climbed rapidly as interest rates rose and inflation eventually eased. By September 2024, our measure had reached roughly +3%.
That’s a swing of close to nine percentage points in about two and a half years.
Based on the traditional relationship, this should have created a substantial headwind for gold.
Instead, the NZ dollar gold price kept rising.
Real rates went from deeply negative to clearly positive, yet gold didn’t respond as the conventional model suggested. Anyone relying on real rates as a gold timing signal could have found this period particularly misleading.
Falling Real Rates Helped Gold Again — For a While
From late 2024, New Zealand real rates began falling again.
Gold initially behaved much more as the traditional relationship would suggest. As real rates fell, the NZ dollar gold price accelerated sharply higher.
Our data through June 2026 shows real rates back below zero. Yet gold has also pulled back from its earlier 2026 spike.
There are periods when real rates appear to be a powerful influence on gold, and periods when other forces are strong enough to overwhelm that relationship.
So what changed after 2022?
What Changed After 2022?
The change in our New Zealand data isn’t unique.
The European Central Bank found that gold prices and real yields were negatively correlated between 2008 and early 2022. After Russia’s full-scale invasion of Ukraine in February 2022, that correlation broke down. The ECB identified geopolitical risk as one factor that may have become more influential.
The chart above uses the US 10-year real Treasury yield, rather than the short-term New Zealand real-rate measure in our own chart. But it shows a similar pattern: the historical relationship became much less reliable after 2022.
Central Banks Stepped Up Their Gold Buying
Central banks had been net buyers of gold for years before 2022. But the scale of buying increased sharply.
Central-bank demand exceeded 1,000 tonnes a year from 2022 to 2024. Buying eased to 863 tonnes in 2025, but remained well above the 473-tonne annual average from 2010 to 2021.
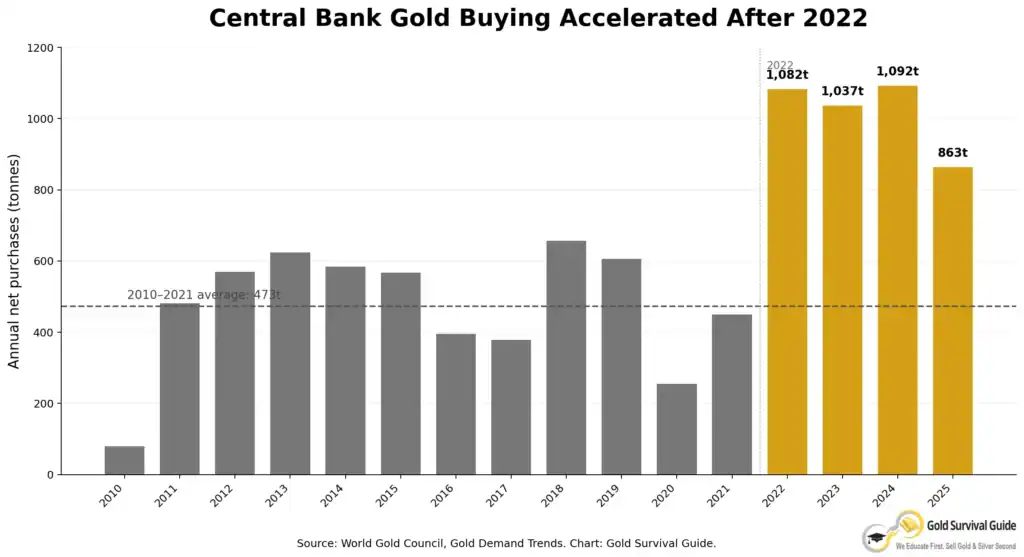
This extra source of demand helps explain why higher real rates haven’t necessarily produced the same headwind for gold seen in some earlier periods.
Did the Freezing of Russia’s Reserves Play a Role?
Following Russia’s invasion of Ukraine in February 2022, sanctions imposed by major reserve-currency economies included freezing foreign-exchange reserves held by the Bank of Russia abroad.
This drew attention to one characteristic of physical gold: gold held within a country’s own borders doesn’t depend on access to another country’s banking system.
IMF research found an association between financial sanctions and increases in the share of central-bank reserves held in gold. The researchers also noted that freezing Russia’s foreign-exchange reserves focused attention on whether reserves could be held in forms better insulated from sanctions.
The ECB found a similar pattern. In five of the ten largest annual increases in gold’s share of foreign reserves since 1999, the countries involved had faced sanctions in the same year or the previous year.
Central banks were already net gold buyers before 2022, so the freezing of Russian reserves doesn’t explain the shift on its own.
But the events of 2022 highlighted one of gold’s unusual properties as a reserve asset: physical gold has no issuer and, when held domestically, doesn’t rely on access to a foreign financial system.
Reserve managers also hold gold for reasons including diversification, crisis performance, long-term value and geopolitical risk. (Source: ECB)
Do Real Interest Rates Still Matter for Gold?
Yes. Real interest rates still affect the relative appeal of gold compared with cash and interest-bearing assets.
When real rates are high and rising, cash or bonds can offer a more attractive return after inflation. When real rates are falling or negative, the opportunity cost of owning gold falls.
But gold responds to other forces at the same time.
These include inflation expectations, movements in the US dollar, investment demand, central-bank buying and geopolitical or financial-system risk.
For New Zealand investors, the NZ dollar adds another variable. The local gold price reflects both the international gold price and the exchange rate.
The balance between these influences can also change. In 2025, for example, central-bank buying eased to 863 tonnes. At the same time, global gold ETF holdings increased by 801 tonnes and total investment demand reached 2,175 tonnes. (Source: gold.org)
Real rates remain one influence on gold, rather than a standalone forecasting tool.
Can Real Interest Rates Tell You When to Buy Gold?
Real interest rates can help assess the environment for gold, but they shouldn’t be treated as a precise buy or sell signal.
Low or falling real rates have historically provided a more favourable backdrop for gold. High or rising real rates can create a headwind.
Between early 2022 and September 2024, however, our measure of New Zealand real interest rates climbed from almost −6% to around +3%. Someone relying on the traditional relationship might have expected the NZ dollar gold price to fall.
It didn’t.
Real rates are more useful for assessing the monetary environment than identifying a precise entry point.
They can show whether conditions are becoming more or less favourable for gold, alongside other indicators.
For someone buying gold primarily as wealth insurance, there is another consideration. The aim isn’t necessarily to predict the next move in the gold price. It’s to own an asset outside the banking system that can help preserve wealth through monetary and financial uncertainty.
Waiting for a perfect real-rate signal could mean remaining completely unprotected while waiting for conditions that never line up neatly.
For more on timing a purchase, see When Should You Buy Gold or Silver?
The Bottom Line
More than 40 years of New Zealand data shows clear periods when falling or negative real rates have coincided with a rising gold price, and rising real rates with a weaker gold price.
But the relationship became much less reliable after 2022.
Real interest rates can tell us whether cash is gaining or losing purchasing power after inflation and how the opportunity cost of owning gold is changing.
Our updated data suggests they are best used alongside other factors rather than as a standalone gold-price or market-timing indicator.
Frequently Asked Questions
Gold has historically tended to perform better when real interest rates are falling or negative. Lower real rates reduce the return available from cash and interest-bearing assets after inflation.
However, the relationship isn’t consistent enough to predict the gold price from real rates alone.
Negative real interest rates can provide a supportive environment for gold because cash is losing purchasing power after inflation.
They don’t guarantee a rising gold price. Exchange rates, investment flows, central-bank demand and other factors can also influence gold.
Our New Zealand data shows real rates rising from almost −6% in early 2022 to around +3% by September 2024, while the NZ dollar gold price also rose.
Strong central-bank demand was one likely contributor. Investment demand, geopolitical risk and currency movements also influenced gold during this period.
A nominal interest rate is the quoted rate. A real interest rate adjusts that rate for inflation.
If an interest rate is 5% and inflation is 3%, the approximate real interest rate is +2%. If inflation is 7%, the approximate real rate is −2%.
Real rates therefore give a better indication of whether money in an interest-bearing asset is gaining or losing purchasing power after inflation.
Editor’s note: This article was first published on 8 May 2012. It has been updated in September 2026 with our latest New Zealand real-interest-rate and gold-price data, plus new analysis.

Glenn's dedication to educating individuals on wealth protection through precious metals has helped over 2400 clients from New Zealand, Australia, USA and Europe to safeguard their financial futures. Passionate about financial independence and lifestyle freedom, Glenn’s mission is to empower others with the knowledge and tools to thrive in today’s volatile economic environment. When he's not advising on precious metals, Glenn enjoys spending time with his family and pursuing outdoor adventures.
Education: University of Auckland Bachelor of Science
Linkedin: https://www.linkedin.com/in/glenn-thomas-0984a4310/
- Gold Prices Fall as ETF Investors and Established NZ Buyers Keep Buying - October 14, 2026
- What Are The Different Types of Gold Bars? - October 13, 2026
- Should I Buy Gold Now or Wait? (2026 NZ Update) - October 12, 2026
