
This Week:
- Weekly Price Overview – 10 June 2026
- Gold vs Shares: What 100 Years Of History Reveals
- Gold Overtakes Treasuries as Investor Interest Fades
- Four Signs Sentiment Has Turned Negative
- Could There Be One Final Shakeout?
- Meanwhile, Central Banks Are Sending A Different Message
- Who Should You Listen To: Investors or Central Banks?
Estimated reading time: 7 minutes
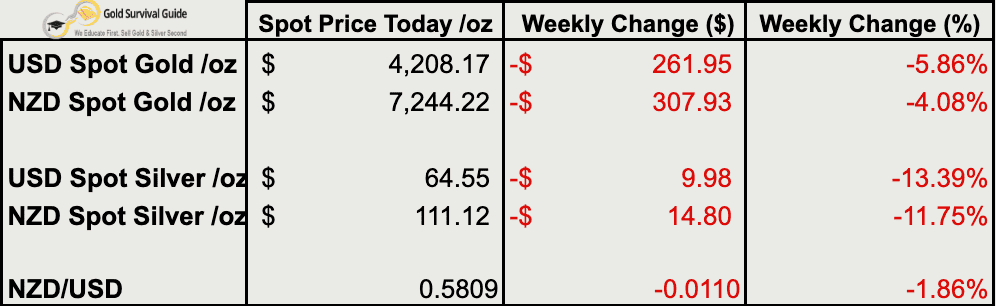
Weekly Price Overview – 10 June 2026
Precious metals were hit hard this week, with silver leading the decline. Gold and silver have now fallen back below several key technical levels, while sentiment across the sector has turned noticeably more bearish. As discussed below, some analysts believe this could be setting up one final shakeout before a major low.
🟡 NZD gold fell $308 (-4.08%) to $7,244
NZD gold broke back below its long-term 200-day MA near $7,550 after failing to hold recent gains. The next key support remains the March low near $7,000. A break below that level could trigger further selling before a more significant bottom forms.
USD gold fell $262 (-5.86%) to $4,208
USD gold has dropped below both its 200-day MA and recent support levels. The March low near $4,000 is now the key level to watch. A retest of that area remains possible.
⚪ NZD silver fell $14.80 (-11.75%) to $111.12
NZD silver suffered an even steeper decline, falling back below both its 50-day and 200-day moving averages. The March low near $105 remains the next major support level and may provide an attractive buying zone.
USD silver fell $9.98 (-13.39%) to $64.55
USD silver has broken below its 200-day MA near $67 and is approaching the March low around $60. Given the current bearish sentiment, a brief dip below that level cannot be ruled out.
💱 NZD/USD fell 110 basis points (-1.86%) to 0.5809
The Kiwi dollar weakened again this week and remains firmly within its long-term downtrend. That weakness continues to support NZ dollar gold and silver prices. A sustained move above 0.61 would be needed to signal a change in trend.
Gold vs Shares: What 100 Years Of History Reveals
What if there was a way to compare gold and shares without using dollars at all?
For more than a century, investors have used the Dow Gold Ratio to track the changing relationship between financial assets and hard assets.
Sometimes shares dominate. Sometimes gold does.
In this week’s featured article, we look at what 100 years of Dow Gold Ratio history can teach us about market cycles, investor psychology and the shifting balance between gold and shares.
More importantly, we explore what the ratio may be telling investors today.
Read: Dow Gold Ratio Explained: What 100 Years Of Gold vs Shares History Reveals
Gold Overtakes Treasuries as Investor Interest Fades
Gold and silver have had a rough week.
Gold has fallen back from its recent highs and silver has been hit even harder. Investor sentiment has changed quickly.
Just a few months ago, gold was one of the world’s most talked-about investments. New highs were making headlines almost weekly. Precious metals were appearing regularly in market commentary and financial news.
Today, the mood is very different. That raises an interesting question.
If the long-term case for gold is getting stronger, why is investor interest fading?
Four Signs Sentiment Has Turned Negative
The first sign comes from New Zealand.
Back in February, gold featured regularly in the ASB Daily Alert emails we receive. New highs were being reported frequently. Mentions continued through March and into April.
Since April 15th, gold has effectively disappeared from those updates. (Unless of course you count their song pick on 5th June!: Walk With Me – GoldFord.)
The second sign comes from Ross Norman at Metals Daily.
Norman recently noted that traffic to MetalsDaily.com has fallen sharply. According to Google Search Console data, website impressions have dropped from 31.5 million in January to 9.7 million in May, while clicks have fallen from just over one million to 271,000.
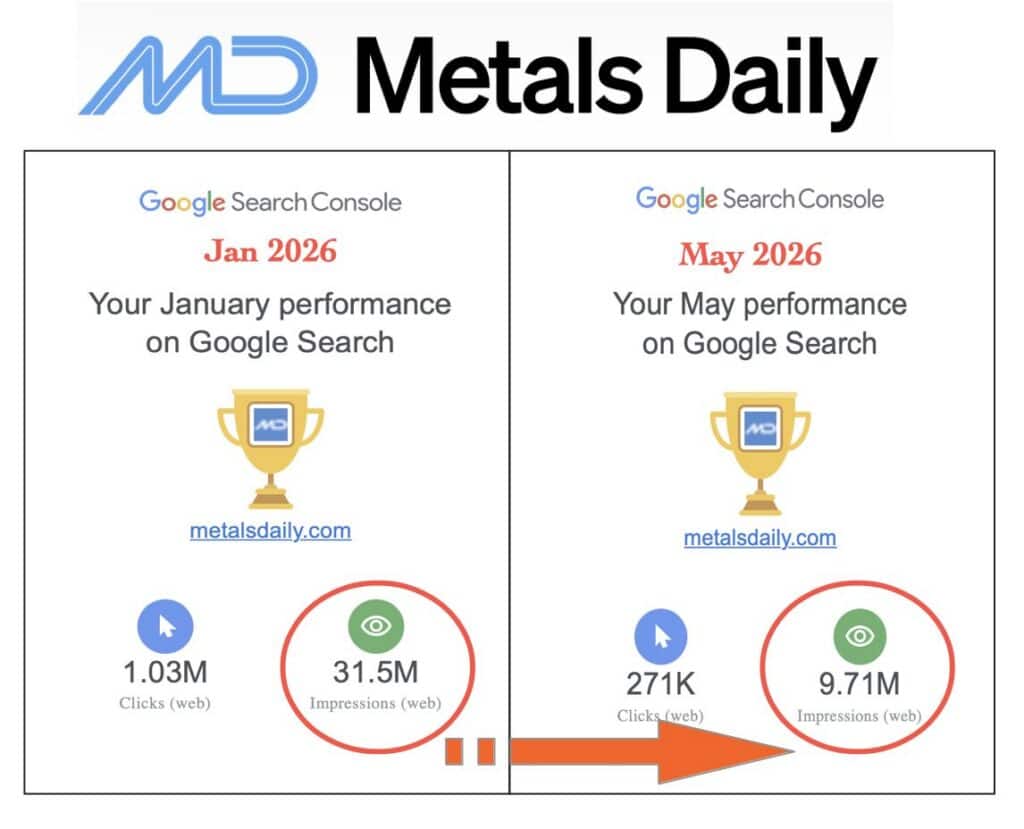
That is a decline of around 70%.
This doesn’t tell us where gold prices go next.
But it does tell us that public interest has fallen sharply.
We’re seeing something similar ourselves.
Traffic to Gold Survival Guide rose sharply during the run to new highs earlier this year. Since then, visitor numbers have eased back noticeably as attention has shifted elsewhere.
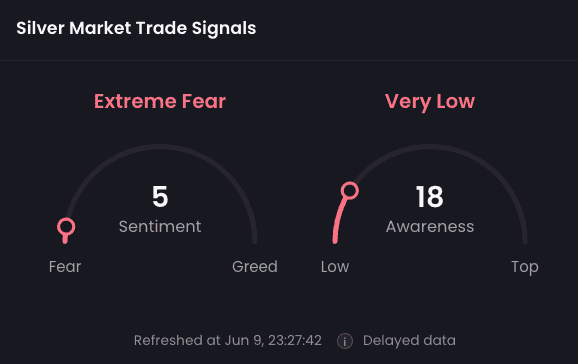
The third sign comes from a sentiment indicator.
The Adalytica Silver Sentiment Indicator currently shows “Extreme Fear” and very low levels of investor awareness.
Fund manager Tavi Costa summed up the shift well:
“Just a few months ago, gold was one of the market’s favourite trades. Today, it feels almost completely forgotten.”
Could There Be One Final Shakeout?
Veteran precious metals analyst Chris Weber believes there may be one final panic sell-off before a major low forms.
Weber recently revisited a lesson he learned during the silver market of 1973.
At the time, silver appeared to have formed an important low. Prices recovered, confidence returned and many investors believed the worst was over.
Then silver fell again.
The previous low was broken. Bearishness surged. Many investors sold.
Only later did it become clear that the second decline had created the real bottom and a major rally followed.
Weber believes today’s market could produce a similar pattern.
Whether he is right remains to be seen.
What is interesting is that experienced precious metals investors are once again talking about panic selling and extreme pessimism.
Historically, those conversations rarely happen near periods of maximum optimism.
Meanwhile, Central Banks Are Sending A Different Message
While investor interest appears to be fading, central banks continue to behave very differently.
This week, considerable attention was given to new ECB data showing that gold now represents 27% of global official reserves by market value.
That places gold ahead of U.S. Treasuries at 22% and ahead of the euro at 15%.
Many headlines reported this as gold overtaking the U.S. dollar.
That is only partly true.
Dollar-denominated assets still account for around 42% of official reserves, meaning the dollar remains the world’s dominant reserve currency.
What has changed is that gold now exceeds any single reserve asset held by central banks.
There is another interesting angle here.
The ECB could just as easily have framed this story as gold overtaking the euro. Instead, attention has focused on gold overtaking U.S. Treasuries.
Whether intentional or not, the discussion has centred on gold versus the dollar.
But perhaps the more important story is not gold versus the dollar at all.
Gold now ranks ahead of both U.S. Treasuries and the euro as a reserve asset. Rather than pointing away from one currency, the data may point to something broader: central banks continue to place increasing value on an asset outside the fiat monetary system.
After all, gold is no one’s liability. It cannot be printed, sanctioned, frozen or devalued by policy decisions.
That may help explain why central banks have been accumulating it at a record pace in recent years.
Whatever the reason, the message is difficult to ignore.
Central banks continue to accumulate gold.
They continue to treat it as an important reserve asset.
And they are doing so at a time when many investors appear to be losing interest.
Who Should You Listen To: Investors or Central Banks?
One of the challenges in investing is separating headlines from longer-term trends.
Sentiment can change very quickly.
A few months ago, gold was making new highs and attracting plenty of attention.
Today, silver sentiment is showing extreme fear, traffic across precious metals websites has fallen sharply and gold has largely disappeared from mainstream market commentary.
Yet at the same time, central banks continue to add gold to their reserves and gold now ranks ahead of both U.S. Treasuries and the euro as a reserve asset.
Those two trends point in opposite directions.
That doesn’t tell us where prices will move next.
But it does raise a question.
If some of the world’s largest institutions continue to see value in holding gold, should individual investors pay more attention to what central banks are doing than to how other investors are feeling?
History suggests that periods of pessimism are often when the best long-term decisions get made.
That doesn’t mean prices can’t fall further from here.
But when sentiment and fundamentals tell different stories, it is worth paying attention.

Glenn's dedication to educating individuals on wealth protection through precious metals has helped over 2400 clients from New Zealand, Australia, USA and Europe to safeguard their financial futures. Passionate about financial independence and lifestyle freedom, Glenn’s mission is to empower others with the knowledge and tools to thrive in today’s volatile economic environment. When he's not advising on precious metals, Glenn enjoys spending time with his family and pursuing outdoor adventures.
Education: University of Auckland Bachelor of Science
Linkedin: https://www.linkedin.com/in/glenn-thomas-0984a4310/
- Watch What Central Banks Do, Not Just What Governments Say - July 22, 2026
- Gold Revaluation: Why the Debate Is Heating Up Again - July 20, 2026
- How the Centre of Gravity in the Gold Market Is Shifting East - July 15, 2026