

Jan
This Week:
Weekly Price Overview – 28 January 2026
Gold and silver delivered another powerful week, with silver again leading the charge. Gold pushed decisively into new all-time highs in both USD and NZD, while silver’s breakout above key psychological levels signals a major repricing phase. The NZ dollar strengthened sharply. It could be reversing the longer-term downtrend that has further boosted local metal prices.
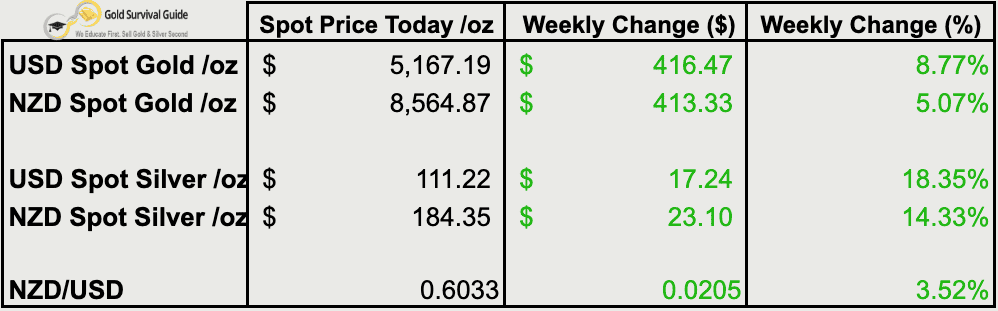
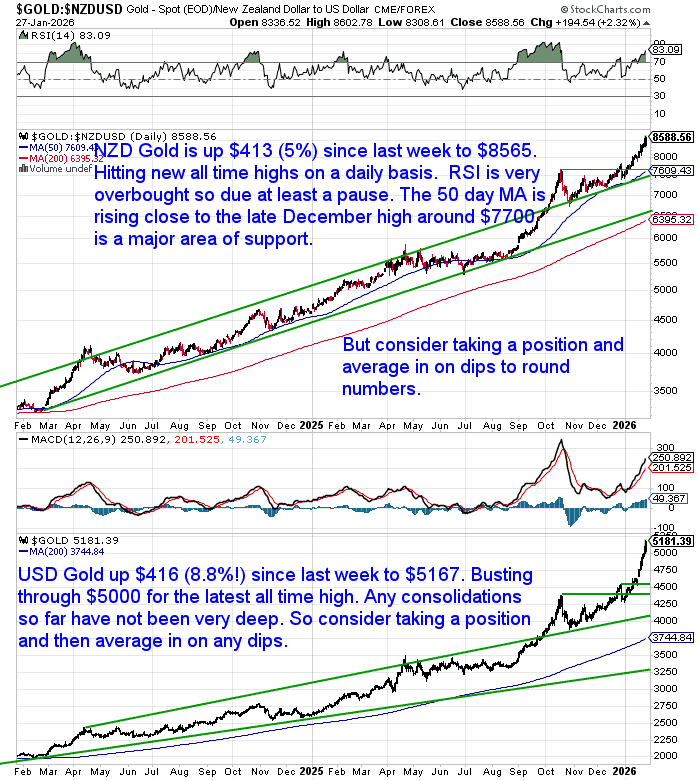
🟡 NZD gold climbed $413.33 (+5.07%) to $8,564.87, hitting fresh all-time highs on a daily basis. Momentum remains strong, though RSI is now very overbought, suggesting a pause or consolidation may be due. The rising 50-day moving average near the late-December highs around $7,700 remains key support.
USD gold rose $416.47 (+8.77%) to $5,167.19, blasting through the $5,000 level to set another all-time high. Consolidations so far have been shallow, favouring taking a position and averaging in on dips.
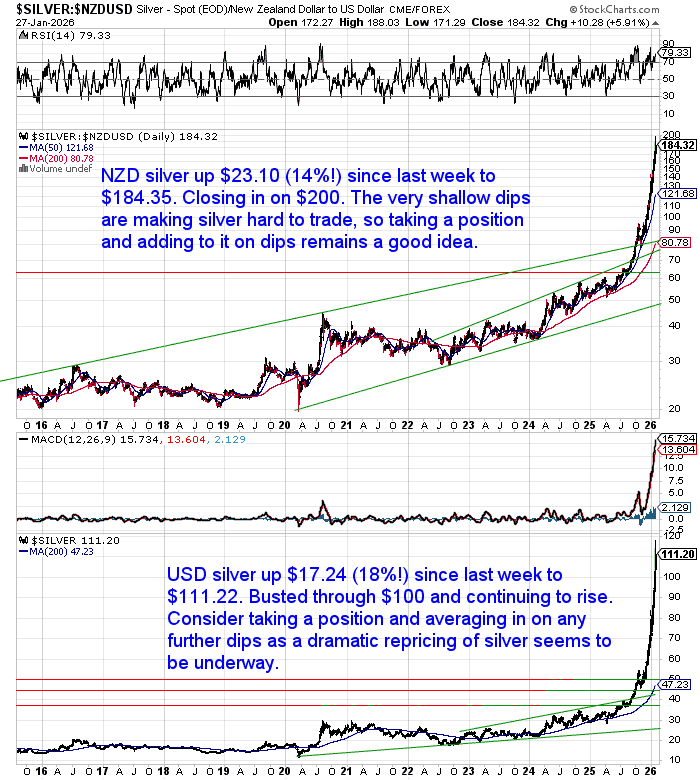
⚪ NZD silver surged $23.10 (+14.33%) to $184.35, rapidly closing in on $200. Dips remain extremely shallow, making silver difficult to trade tactically — but reinforcing the case for building positions on pullbacks.
USD silver jumped $17.24 (+18.35%) to $111.22, decisively breaking above $100 and continuing higher. This price action suggests a dramatic repricing of silver is underway.
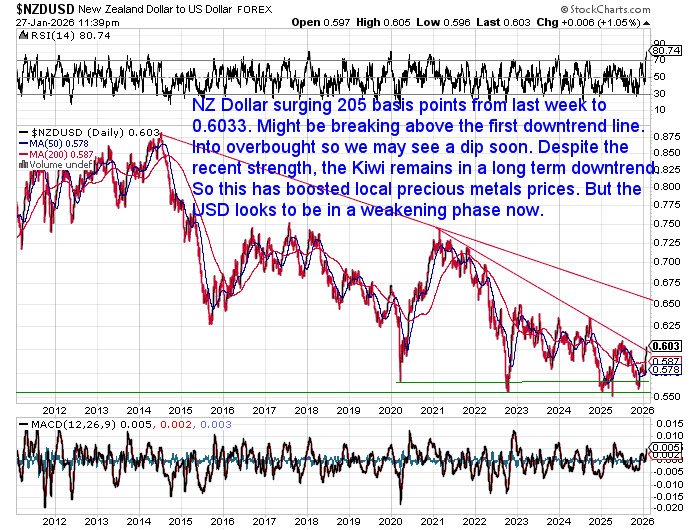
💱 NZD/USD rallied 205 basis points (+3.52%) to 0.6033. While the Kiwi has surged into short-term overbought territory and may pause, it remains in a longer-term downtrend. But further NZD strength could moderate local gains.
📈 Takeaway: Silver remains the clear standout, with price action showing almost no meaningful pullbacks. Gold is confirming its breakout, pushing rapidly into new all-time highs. While near-term consolidations are likely, the broader trend for both metals remains firmly upward.
NZ Snapshot: Inflation Up, Gold Soars, But the Media Misses the Point
This week we saw more signs that uncertainty is far from over.
Inflation Still Running Hot
Q4 inflation came in at 3.1%. That’s above RBNZ expectations, though in line with ASB’s forecast.
But here’s the key: core inflation is not cooling. ASB says a rate hike in 2026 is now a real risk.
If that happens, it’s more pain ahead for mortgage holders.
Higher than expected inflation and interest rates were one of our predictions for 2026. So for everyday Kiwis, this means uncertainty is still the dominant trend.
Gold Hits US$5,000 – But Few Understand Why
Gold hit a record high this week. Over US$5,000 an ounce.
Radio NZ pointed to tensions over Greenland, Chinese gold buying, and central bank demand.
Sure, that’s part of it.
ASB claims it’s mostly down to 2025’s “Liberation Day” tariffs. That misses the big picture.
What’s really happening? A global shift away from trust in paper money. Central banks ramped up gold buying after Russia’s USD reserves were seized in 2022. Nations are hoarding it. Investors are waking up.
At Gold Survival Guide, we believe you should understand not just what’s happening, but why — and how you can protect yourself in advance.
Our Takeaway
Inflation is sticky. Rates may rise again. Global tensions are rising. And gold is soaring.
Now is the time to ask yourself:
Do I have a hedge outside the system?
Gold and silver aren’t just going up. They’re being repositioned as strategic assets — not just by investors, but by nations.
If the smart money is moving to metals… shouldn’t yours be too?
Silver Surges Past US$110 – What’s Really Going On?
Silver surged past US$110/oz this week. According to analyst Vince Lanci, it wasn’t due to speculation or manipulation. Instead, it appears to be a byproduct of industrial panic, geopolitical chess, and a scramble for control over global supply chains.
Here’s the simplified version of what Lanci believes is unfolding:
Defensive Hoarding, Not Deliberate Squeezing
Lanci dismisses the idea that JP Morgan is being squeezed by China, or vice versa. Instead, both sides are pulling back, hoarding strategic resources like silver, copper, and oil in response to increasing global tension – particularly around access to Latin America’s natural resources.
“Everyone is retreating to their corner. Everyone is hoarding supply. Everyone is acting in self-interest.” – Vince Lanci
It may look like a squeeze, but Lanci sees it as defensive economic warfare.
US vs China: Commodity Supply Chains Are the New Battlefield
The US appears to be pushing China out of Latin America to disrupt long-established supply chains. That includes silver – a metal crucial for solar energy, electronics, and military tech.
As the US shores up access to critical resources, China finds itself importing commodity inflation, particularly through industrial silver, which has crippled margins in Chinese and Indian solar manufacturers.
US bullion banks like JP Morgan aren’t celebrating — they’re caught in the middle. They may be aligned with government goals but aren’t necessarily profiting from the price moves.
What Does This Mean for You?
Silver’s current price surge might not be short-lived. It could reflect a longer-term reshuffling of how – and where – strategic metals are sourced and stockpiled.
Lanci’s belief is that silver’s price action has been driven by industrial users front-running investment demand. This could mean the price remains high for retail investors if this continues.
Main Takeaway:
The silver market is no longer just about supply/demand or investor sentiment – it’s increasingly tied to national security, trade leverage, and geopolitical power. The takeaway? Physical bullion remains one of the few assets outside the system and immune to third-party risk.
If there were ever a time to consider precious metals not just as a store of value, but as a strategic asset, that time is now.
Surging Demand Signals – What Happens Next?
We’ve also seen a big uptick in local demand for bullion over the past month — and unusually strong interest over the holiday period.
It’s not just here. In the US, Dillon Gage, one of the largest wholesalers, reports they’re running three shifts, seven days a week to meet demand.
“We can’t keep up,” says CEO Terry Hanlon.
Mainstream media is catching on too. Silver’s rally made headlines in The Financial Times, with silver now reportedly the second-best performing asset in the world.
With that kind of attention, a pause or pullback wouldn’t be surprising. In fact, it could be healthy. But let’s not forget:
Despite headlines and spikes, we’ve yet to see a proper correction in over a year — just breathers along the way.
This is what makes a strong bull market very hard to time. As we often say, dollar cost averaging is likely the best strategy.
Chart of the Week: Gold vs the S&P 500 – Just Getting Started?
This chart from Crescat Capital shows historical periods when gold outperformed the S&P 500 over rolling 10-year stretches.
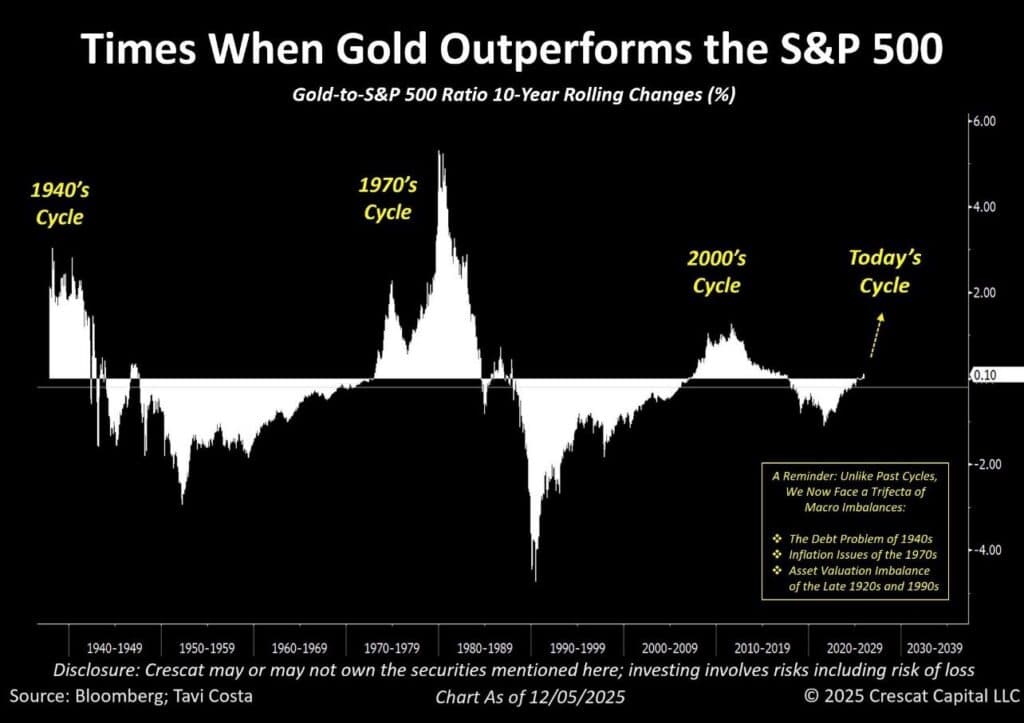
Gold and silver are rising stroongly – but this chart suggests we’re still early in the current cycle. Gold’s performance, relative to stocks, remains well below the peaks seen in the 1940s, 1970s, and 2000s.
That suggests two things:
- A pause or pullback would be normal, even healthy.
- Long-term upside may still be substantial, especially if macro risks continue to unfold.
Today’s cycle combines debt, inflation, and asset bubbles – just like past gold surges. Worth keeping in mind before sitting on the sidelines.

Glenn's dedication to educating individuals on wealth protection through precious metals has helped over 2400 clients from New Zealand, Australia, USA and Europe to safeguard their financial futures. Passionate about financial independence and lifestyle freedom, Glenn’s mission is to empower others with the knowledge and tools to thrive in today’s volatile economic environment. When he's not advising on precious metals, Glenn enjoys spending time with his family and pursuing outdoor adventures.
Education: University of Auckland Bachelor of Science
Linkedin: https://www.linkedin.com/in/glenn-thomas-0984a4310/
- Gold Prices Fall as ETF Investors and Established NZ Buyers Keep Buying - October 14, 2026
- What Are The Different Types of Gold Bars? - October 13, 2026
- Should I Buy Gold Now or Wait? (2026 NZ Update) - October 12, 2026
