(and why they will everywhere else too if they haven’t already)
June 2009 news headlines highlight the ongoing strength of the NZ Dollar (kiwi). Having risen from a low of just under 0.50USD in March 09, the kiwi reached a high of 0.65USD less than 3 months later. A rise of some 30%!
The high dollar makes New Zealand’s exports more expensive for other countries to buy. When also coupled with the price of key commodities, such as milk solids’ falling, kiwi exporters are really hurting.
Exports make up about 30% of the New Zealand economy, and falling export returns mean less income for the country. This has a flow on effect of less spending, both investment and consumer, the end result eventually being higher unemployment.
The high dollar hasn’t escaped the notice of the country’s leader either, with a recent Bloomberg article titled “Key says New Zealand Dollar gains may derail recovery”.
The last thing politicians want is high unemployment as the unemployed vote too – and usually not for the incumbents.
Furthermore, the NZ dollar is strong despite the RBNZ currently having the lowest interest rates ever (2.5%). Usually a low interest rate will result in a lower exchange rate as international investors look elsewhere for higher returns on their money.
But the fact is that in a worldwide recession (or maybe depression) almost every other nation is facing the same problems of:
– less demand for the commodities or goods they produce.
– high debt
And they’re also trying to solve this with low central bank initiated interest rates.
So what does this hold for the future?
While Reserve Bank Governor Alan Bollard has been and will do his best to “jaw bone” or talk down the dollar, this has very limited effect. Even John Key in the above quoted article admits there is a limit to what current monetary policy can do.
This is why we believe it is virtually a given that at some point in the not too distant future the RBNZ will initiate a “quantitative easing” policy as the likes of the USA, UK and Europe have already done.
Quantitative what?
Quantitative Easing is Reserve Bank speak for money printing or money creation.
The aim is to water down or devalue the currency, thereby making the nation’s exports cheaper to foreign buyers. Basically if more of a currency – i.e. the Kiwi dollar – exists, this means it will take less foreign currency to purchase New Zealand products.
However this is a very definite double edged sword. As while exports may get cheaper, it will also have the effect of reducing the buying power of the NZD and making everyday goods such as food and fuel more expensive for the average citizen.
The major problem with this “solution” is that it’s likely that every other central bank will be trying it too. The name of the game is “Competitive Devaluation”. Something like the limbo stick for Central Banks – “How low can you go?”
So any benefit is likely only to be temporary until the next country also devalues.
So if everyone is trying to make their currency cheaper where will it stop?
As more and more paper currency is created worldwide the likelihood is that we will see very high rates of inflation. More paper dollars chasing the same amount of goods equals higher prices for those goods.
And if the money makers go too far, we may potentially even see hyperinflation in developed nations. Renowned investor and writer Marc Faber says they’ve gone too far already and hyperinflation is 100% guaranteed in the US.
While this may be hard to believe when all you hear is the talk of deflation in the mainstream, just remember it was the same mainstream that said the sub prime mortgage problem in the US was contained and only going to be a minor blip.
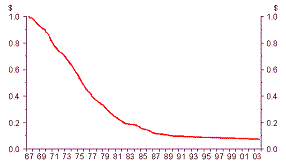
For a reminder of the effects of inflation, have a look at the below graph care of the RBNZ website which shows the 93% loss of purchasing power of the NZ dollar since 1967. $1.00 from 1967 is equivalent to less than 10 cents in purchasing power today!

If we had to draw a line on this graph for the coming years, our pick is that it will slope steeply down to the right again just like it did in the 70’s.
The signs are there if you want to read them and they say: ‘Warning: High inflation and high interest rates ahead”. Ignore them at your peril…
Like to know how you can protect yourself from this potential outcome? Click here to learn more about our free 8 part eCourse.

