
Monetary System
How the Centre of Gravity in the Gold Market Is Shifting East

Jul
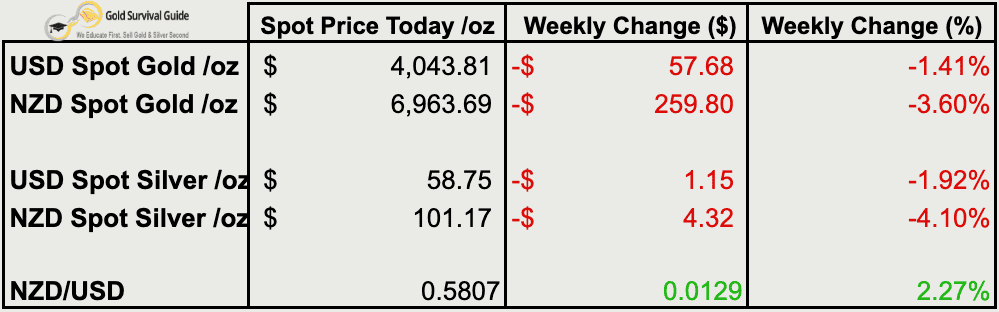
Table of contents
Estimated reading time: 6 minutes
Weekly Price Overview – 15 Jul 2026
Precious metals eased lower this week after last week’s rebound. Gold and silver both retested support as the stronger Kiwi dollar weighed on local prices. Averaging in continues to look sensible while these long-term buying zones are tested.
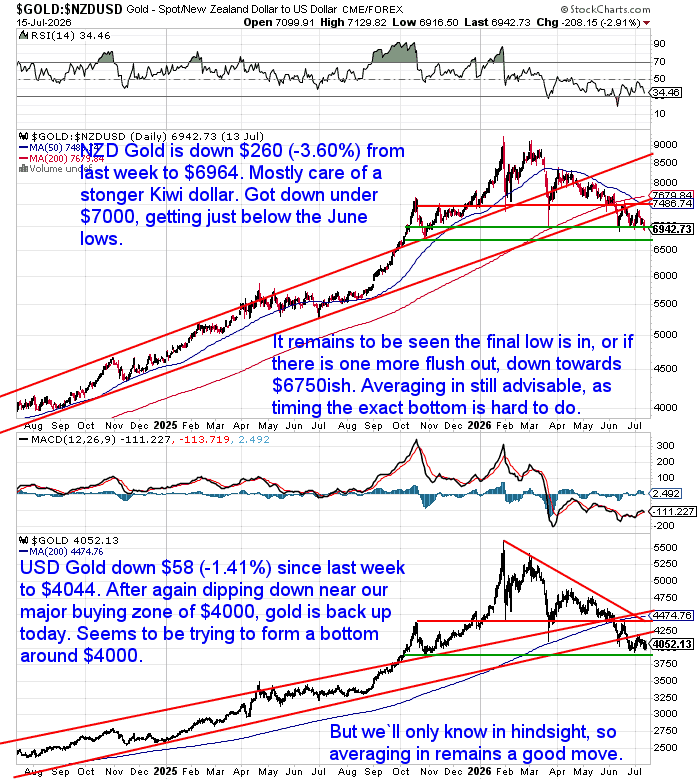
🟡 NZD gold fell $260 (-3.60%) to $6,964
NZD gold slipped back below $7,000, largely due to the stronger Kiwi dollar. It briefly fell below the June low before recovering. Another dip towards $6,750 remains possible, so averaging in still looks sensible.
USD gold fell $58 (-1.41%) to $4,044
USD gold again tested the major $4,000 buying zone before bouncing. It still appears to be forming a bottom around this level. Averaging in remains a sensible approach.
⚪ NZD silver fell $4.32 (-4.10%) to $101.17
NZD silver pulled back after last week’s rebound and again tested the October 2025 support area. It remains in an excellent long-term buying zone. Averaging in continues to make sense.
USD silver fell $1.15 (-1.92%) to $58.75
USD silver also retested support after its recent bounce. Whether the final bottom is already in remains to be seen, but it continues to represent a very good long-term buying zone.
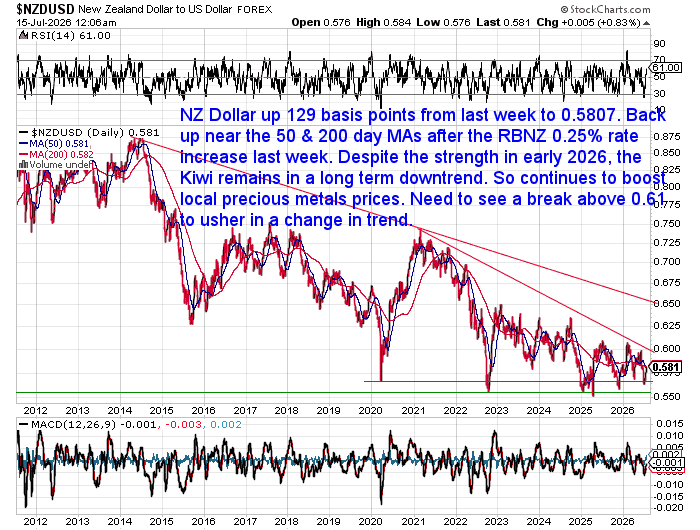
💱 NZD/USD rose 129 basis points (+2.27%) to 0.5807
The Kiwi dollar strengthened after last week’s RBNZ rate cut and is back near its 50 and 200-day moving averages. The longer-term trend remains down, so it continues to support local precious metals prices.

The Question Most Gold Investors Never Think to Ask
Gold investors often ask, “How high could gold go if the US dollar collapsed?” But that may not be the most important question. If confidence in the dollar was truly lost, what would gold and silver actually be measured against? This week’s featured article explores the possibilities – and why the answer matters more than many people realise.
Read the full article here → If/When the US Dollar Collapses, What Will Gold (and Silver) be Priced in?

The Centre of Gravity in the Gold Market Continues to Shift East
Asia Is Building the Infrastructure
For decades, Asia has bought the majority of the world’s physical gold, yet London and New York have remained the centres where global gold prices are discovered. That imbalance may slowly be starting to change.
This week, Hong Kong launched a new central gold clearing and settlement system. It also launched a live delivery link with the Shanghai Gold Exchange and introduced a new Asian gold benchmark.. [Source: Reuters]. None of this changes the monetary system overnight. However, it does represent another piece of the financial infrastructure Asia would need to play a much larger role in the global gold market.
The Physical Gold Is Already Moving East
The new infrastructure is being built as physical gold continues to flow towards Asia. During the first half of 2026, US gold ETFs recorded net outflows of more than 60 tonnes. Over the same period, Chinese and Indian funds added almost 53 tonnes between them.
Recent gold price action increasingly looks like a change of ownership rather than a change in sentiment, with physical gold steadily moving from Western investors to Asian buyers.
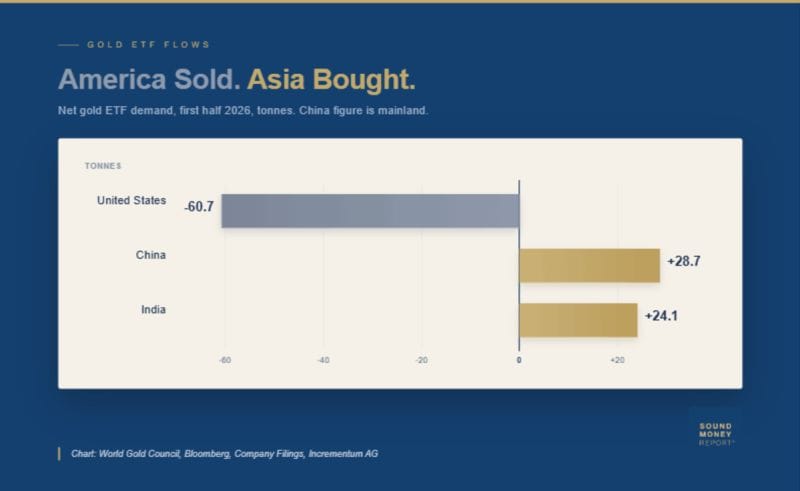
Only use this when reposting on the website not in the email] Gold ETF flows suggest ownership continues to shift from West to East.
Source: Sound Money Report
Western Investors Are Still Largely Missing the Move
If Asia is accumulating more physical gold, who is selling it? In many cases, the answer appears to be Western investors. Despite gold reaching record highs, many still have surprisingly little exposure to the sector.
The latest UBS Global Family Office Report found allocations to gold and precious metals remained unchanged at just 2%, even after a record year of portfolio reshuffling.
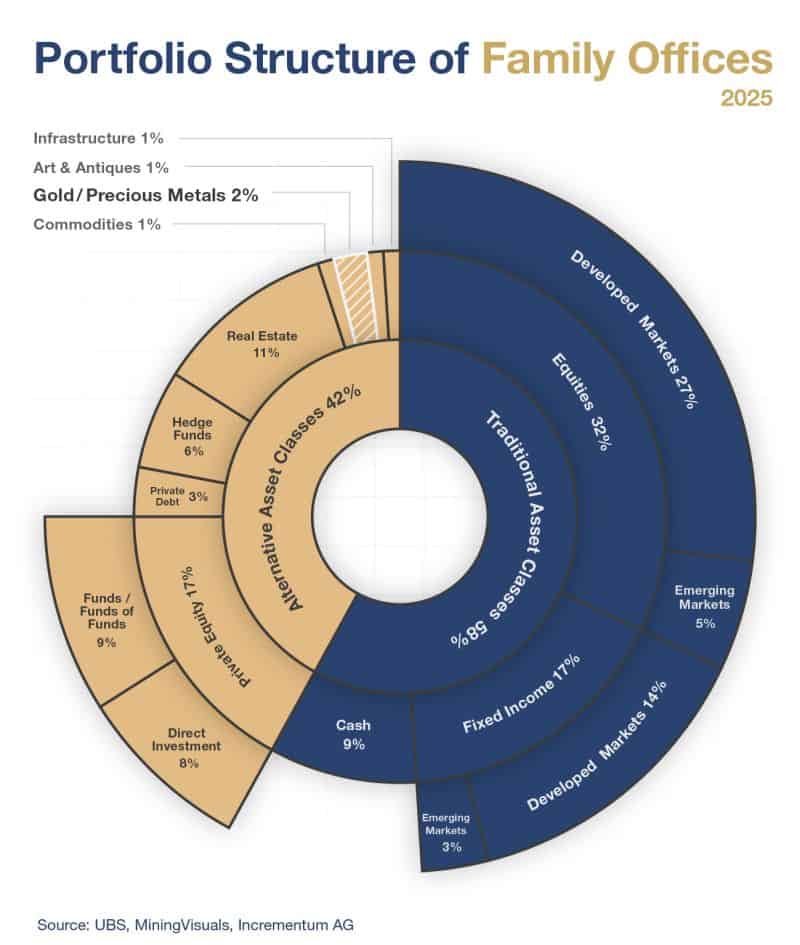
Only use this when reposting on the website not in the email] Despite gold’s strong performance, the average global family office still allocates just 2% of its portfolio to precious metals.
Source: In Gold We Trust Report
As the In Gold We Trust Report observed, one of the biggest bull markets in gold has unfolded largely without broad participation from Western financial investors.
That also matches what we’re seeing here in New Zealand, where physical buying remains relatively subdued.
Taken together, these developments paint a picture of gradual rather than dramatic change. That’s exactly what this week’s featured article explores. It looks at seven possible scenarios if the US dollar’s dominance continues to decline. If history is any guide, change is more likely to come through a series of small steps than a single overnight event.
One theme runs through this week’s wrap: the world doesn’t change overnight, but it does change.
If you’d like to understand how these long-term shifts could affect your own wealth—or whether physical gold and silver deserve a place in your portfolio—we’re always happy to have a conversation. No pressure, just practical guidance to help you make an informed decision.
Whether you decide to invest or not, our goal is the same as it’s always been: to help New Zealanders better understand money, wealth protection and the role physical gold and silver can play. If we can help answer your questions, we’d love to hear from you.

Glenn's dedication to educating individuals on wealth protection through precious metals has helped over 2400 clients from New Zealand, Australia, USA and Europe to safeguard their financial futures. Passionate about financial independence and lifestyle freedom, Glenn’s mission is to empower others with the knowledge and tools to thrive in today’s volatile economic environment. When he's not advising on precious metals, Glenn enjoys spending time with his family and pursuing outdoor adventures.
Education: University of Auckland Bachelor of Science
Linkedin: https://www.linkedin.com/in/glenn-thomas-0984a4310/
- NZ Inflation Could Hit 4.5%: What It Means for Gold - October 21, 2026
- What Type of Gold Bar Should I Buy? (Best Sizes, Brands & Bars Explained) - October 20, 2026
- Gold Prices Fall as ETF Investors and Established NZ Buyers Keep Buying - October 14, 2026
