

This Week:
Estimated reading time: 6 minutes
Weekly Price Overview – 29 April 2026
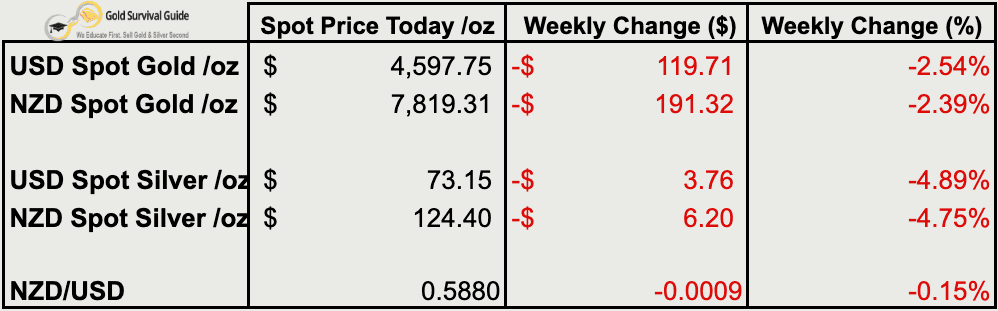
Precious metals moved lower again this week, with both gold and silver pulling back in USD and NZD terms. The broader uptrend remains intact, but short-term consolidation continues.
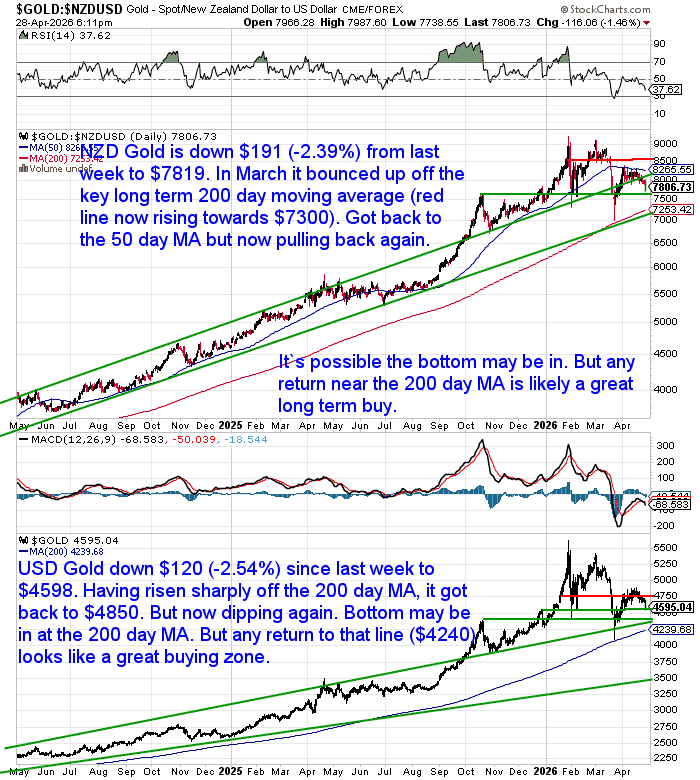
🟡 NZD gold fell $191.32 (-2.39%) to $7,819.31.
The move was driven mainly by weaker USD gold, with the Kiwi largely unchanged. Price is holding near the 50-day MA after bouncing off the 200-day MA (around $7,300) in March. Trend remains up. Any pullback toward the 200-day MA would likely offer a strong long-term entry.
USD gold dropped $119.71 (-2.54%) to $4,597.75.
After rebounding from the 200-day MA (near $4,240), gold pushed toward $4,850 before pulling back again. It’s now consolidating, with the broader uptrend intact. A move back toward the 200-day MA would likely present a solid buying zone.
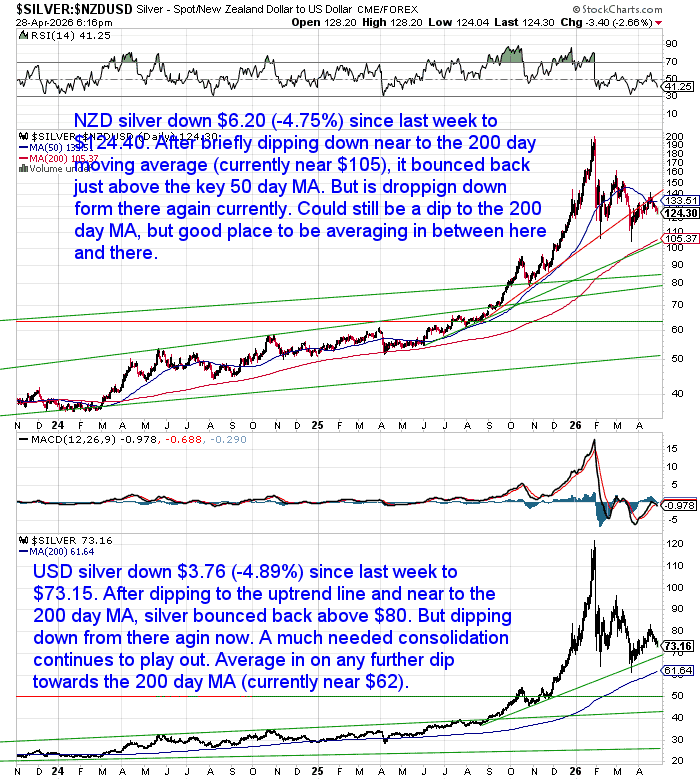
⚪ NZD silver fell $6.20 (-4.75%) to $124.40.
Silver dipped after briefly bouncing near the 200-day MA (around $105) and reclaiming the 50-day MA. It’s now pulling back again. Volatility remains high, but the uptrend is intact. Dips between the 50-day and 200-day MAs look suitable for averaging.
USD silver declined $3.76 (-4.89%) to $73.15.
After rebounding from the uptrend line and the 200-day MA (near $62), silver moved back above $80 before easing again. Consolidation continues after the strong rally. Any deeper pullback toward the 200-day MA could offer value.
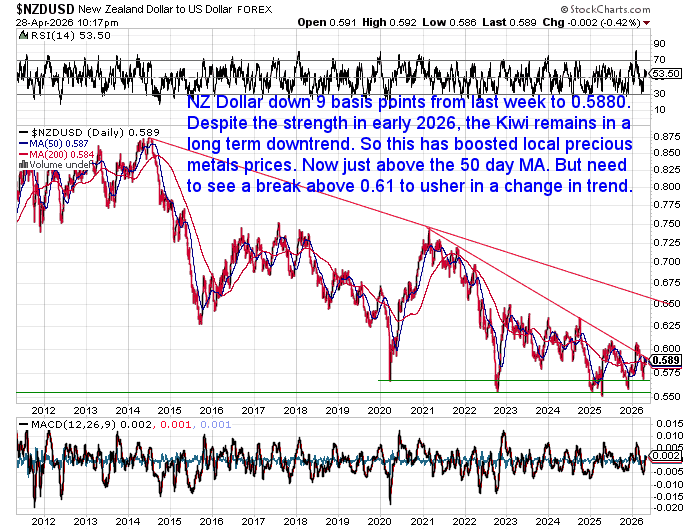
💱 NZD/USD slipped 9 basis points (-0.15%) to 0.5880.
The Kiwi remains in a broader downtrend despite strength earlier this year. This continues to support NZD precious metals prices. A sustained break above 0.61 is still needed to signal a trend change.
New Fed Head, Same Problem?
There’s been growing attention this week on Kevin Warsh, a leading candidate to replace Jerome Powell as head of the Federal Reserve.
At first glance, markets seem to like what they hear.
Warsh has been openly critical of quantitative easing (QE), calling it:
“reverse Robin Hood… policy that steals from the poor to give to the rich.”
That has led to the view that a Warsh-led Fed could take a harder line – less money printing, more discipline.
But this is where theory and reality diverge.
The Illusion of Choice
Warsh has suggested that if stimulus is needed, cutting interest rates is a fairer tool than QE.
In theory, that’s true. Lower rates affect the whole economy. QE tends to lift financial assets first.
He’s also spoken about the importance of “Fed independence”.
Again – reasonable in theory. (Although in reality we’d be better off with no central banks, but that’s for another day).
But there is a hard constraint underneath all of this:
the scale of government debt.
At current levels, the system has very little room to manoeuvre.
The priority is no longer fine-tuning the economy.
It’s keeping the debt affordable.
And that means one thing:
rates must go lower over time.
So as usual when it comes to politicians or bureaucrats it’s a good idea to…
Watch What They Do, Not What They Say
If there was one comment from Warsh this week that mattered, it wasn’t about QE.
It was this:
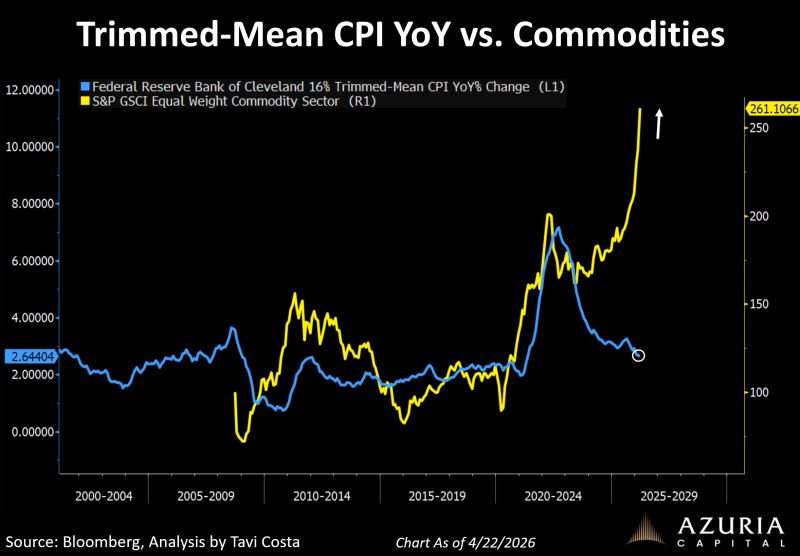
He favours using a “trimmed-mean inflation” measure.
That might sound minor. But we don’t think it is.
As the chart shows, trimmed inflation is one of the few measures trending lower — even as commodity prices rise.
Source: Tavi Costa
By adjusting how inflation is measured, it becomes easier to justify cutting rates… even if underlying inflation pressures remain.
Hard Assets vs Financial Assets
The bigger picture hasn’t changed.
Since the early 1970s, when the link between gold and the US dollar ended, the system has relied on expanding money and credit.
This creates cycles.
At extremes, financial assets become overvalued relative to real assets. Then the cycle turns.
The chart shows this clearly.
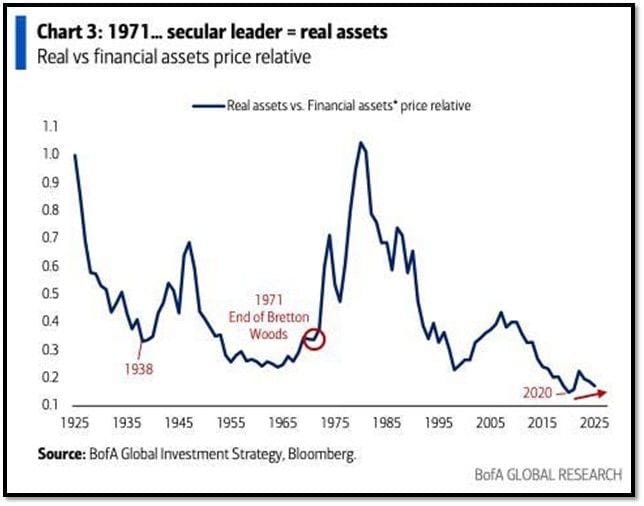
We are still near historic lows in real assets relative to financial assets.
That’s not where long-term cycles tend to end.
The Shift Back to Gold Is Underway – And Still Has Further to Go

Source: Incrementum In Gold WE Trust 2026 Preview Chartbook
Gold has corrected in the short term.
But the underlying trend remains.
A recent Deutsche Bank report suggests gold could move toward $8,000 over the next five years.
The number matters less than the reason behind it.
This is not about monetary theory. It’s about geopolitics.
We are seeing a steady shift away from the US dollar in global reserves – not into other currencies, but into gold.
- USD reserves have fallen from around 60% toward 40%
- Gold has risen from around 10% to just under 30%
- Emerging markets are leading the buying
That last point is what matters most. They still hold relatively low levels of gold.
Which means the trend does not need to accelerate to continue.
It simply needs to persist.
Deutsche Bank describes this as a potential “return to history” – where gold once again becomes a core reserve asset.
The Bottom Line
Whether it’s Powell, Warsh, or anyone else…
The constraints remain the same.
- Too much debt
- Too little room to tighten
- Increasing pressure to ease
So while the language may change – less QE, more discipline, new inflation measures – the direction is unlikely to.
In reality, there is no real choice.
The path is to keep inflating.
And it is why the long-term case for gold and silver remains intact.
If you haven’t already, it may be worth reviewing how much of your wealth sits outside the system.
Get in touch if you’d like help.

Glenn's dedication to educating individuals on wealth protection through precious metals has helped over 2400 clients from New Zealand, Australia, USA and Europe to safeguard their financial futures. Passionate about financial independence and lifestyle freedom, Glenn’s mission is to empower others with the knowledge and tools to thrive in today’s volatile economic environment. When he's not advising on precious metals, Glenn enjoys spending time with his family and pursuing outdoor adventures.
Education: University of Auckland Bachelor of Science
Linkedin: https://www.linkedin.com/in/glenn-thomas-0984a4310/
- Why Own Gold When It Pays No Interest or Dividends? - August 12, 2026
- Why Buy Gold? A New Zealand Guide to Protecting Your Wealth - August 11, 2026
- When the Crowd Loses Interest, Who Keeps Buying? - August 5, 2026
