How many ounces of silver does it take to buy a house in New Zealand today?
It might sound like a strange question. But it’s one that can reveal a lot about whether silver is currently cheap or expensive relative to real estate — or vice versa.
That’s what the housing to silver ratio tells us.
It’s a simple concept: take the median house price in NZ and divide it by the current silver price. You’ll get the number of ounces of silver needed to buy the average home. And just like its cousin, the housing to gold ratio, it can highlight whether silver is undervalued, or housing is overpriced — or both.
Gold Survival Guide first published NZ housing-to-silver ratio analysis on 29 March 2011, with underlying historical data going all the way back to 1968. This fully updated 2025 edition includes revised charts, historical comparisons, and the latest NZ housing and silver market data.
We’ve been tracking this ratio since 1968. And the updated 2025 numbers tell a pretty interesting story — especially if you’re a silver investor, or just someone curious about the true cost of housing through time.
This article gives you a rare long-term view — from the latest 2025 data all the way back to 1968 — showing how house prices and silver have moved against each other.
You’ll discover:
- how affordable NZ homes are in silver terms today,
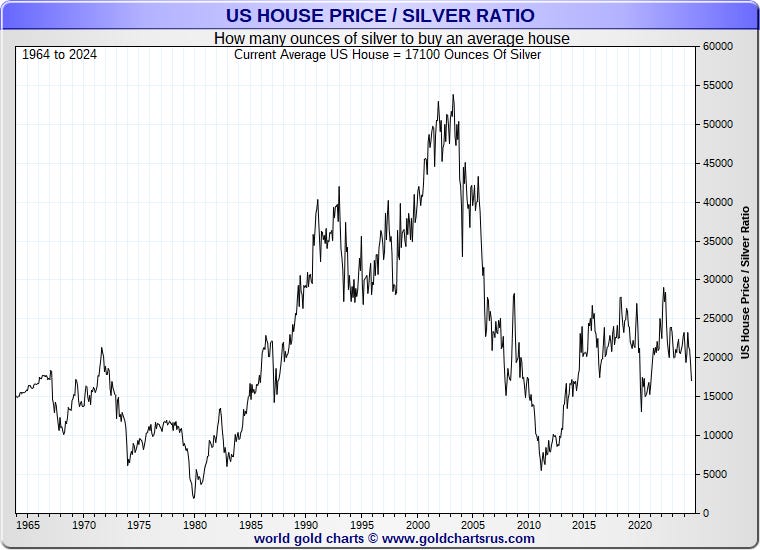
- how New Zealand compares to countries like the US and UK,
- historical extremes in silver’s purchasing power,
- and what silver’s buying power could potentially look like in the years ahead.
Whether you’re a silver stacker, property investor, or macro trend watcher, this is a unique lens on real value over time.
Quick Answer: What Is the NZ Housing-to-Silver Ratio in 2025?
As of 2025, it takes roughly 11,800 ounces of silver to buy the median-priced New Zealand house, based on a median house price of around NZ$761,000 and a silver price near NZ$64.71 per ounce.
That’s down sharply from almost 30,000 ounces during the 2021 housing peak, showing silver has recently gained significant ground against NZ property prices.
Historically, the ratio fell below 1,000 ounces during the 1980 precious metals bull market — highlighting just how dramatically silver’s purchasing power can change over time.
Why Investors Watch the Housing-to-Silver Ratio
The housing-to-silver ratio compares the value of New Zealand property against silver over time.
When the ratio is high, housing is expensive relative to silver. When the ratio falls, silver is gaining purchasing power against real estate.
Many long-term precious metals investors use ratios like this to identify major valuation extremes and potential turning points in financial markets.
Table of contents
- Quick Answer: What Is the NZ Housing-to-Silver Ratio in 2025?
- What is the Housing to Silver Ratio?
- Why Compare Housing to Silver?
- Current NZ Housing to Silver Ratio (2025)
- Historical Trends & Extremes in NZ’s Housing to Silver Ratio
- NZ House Price to Silver Ratio (Log Scale)
- 2025 Global Housing-to-Silver Ratio Comparison
- Silver’s Potential Buying Power: What Could It Really Get You?
- Conclusion & Key Takeaways
- FAQs: Housing to Silver Ratio Explained
Estimated reading time: 17 minutes
What is the Housing to Silver Ratio?
The housing to silver ratio shows how many ounces of silver it would take to buy a house — usually based on the median house price and the current silver spot price, both in the same currency.
For example:
- NZ median house price: $761,000
- Silver spot price: $64.71/oz
- Ratio = $761,000 ÷ $64.71 = ~11,760 ounces
It’s a simple way to compare real estate and silver over time, stripping away inflation, interest rate noise, and currency effects.
How to Calculate the Housing-to-Silver Ratio (3-Step Guide)
How to Calculate the Housing-to-Silver Ratio (3-Step Guide)
- Get the median house price
Look up the latest median residential house price in your country or region. For New Zealand, REINZ and QV are good sources.
- Find the current silver price per ounce
Use a trusted source for the spot silver price in your local currency. You can check our live silver charts or international sources like Kitco or silverprice.org.
- Divide the house price by the silver price
This gives you the number of ounces of silver needed to purchase the median house.
Why Compare Housing to Silver?
Why This Ratio Matters
It shows how much real-world buying power silver holds — and how that changes over time. When the ratio falls, it means silver is gaining ground on housing. It’s a long-term value signal for both asset classes.
If you’re wondering why we bother comparing housing prices to silver, it’s not just an academic exercise.
It’s about getting a clearer picture of relative value — and identifying turning points in long-term trends.
When the housing-to-silver ratio is high, it tells us housing is expensive in silver terms, and silver is cheap by comparison. When the ratio falls, it means silver is catching up — or that housing is falling in real terms.
It’s one thing to track silver prices in dollars. But comparing silver to real assets like property gives us a more meaningful sense of what it can actually buy.
That’s why we’ve tracked this ratio — and its gold counterpart (see Housing to Gold Ratio) — for over a decade. It can help highlight when silver is undervalued, or when housing may be peaking.
And as you’ll see in this update, 2025 has brought one of the biggest year-on-year moves in this ratio that we’ve seen in over a decade.
Why use median house prices?
We use median (not average) because it gives a more accurate picture of what the “typical” house sells for — less skewed by ultra-high-end properties.Some global data uses average prices, which can make the ratio appear higher. That’s why we focus on median for NZ, to give a more grounded view.
Current NZ Housing to Silver Ratio (2025)
As of August 2025, the NZ median house price sits at $761,000, while the spot silver price is just under NZ$65 per ounce.
That gives us a Housing to Silver Ratio of roughly 11,700 ounces.
Calculation:
$761000 ÷ $64.71 = 11760 ounces
So, you’d need nearly 11,800 ounces of silver to buy the median NZ house today.
That’s a significant drop from last year’s ratio of around 16,000 ounces.
Back in Sept-2024, the median NZ house price was hovering closer to $780,000, while silver was trading around $48/oz. Since then, silver has risen over NZ$20/oz, while housing prices have eased slightly.
That combination has caused the ratio to drop by over 25% in just 12 months — one of the largest year-on-year moves we’ve seen in over a decade.
Here’s the updated chart showing how the housing to silver ratio has changed since 1968:
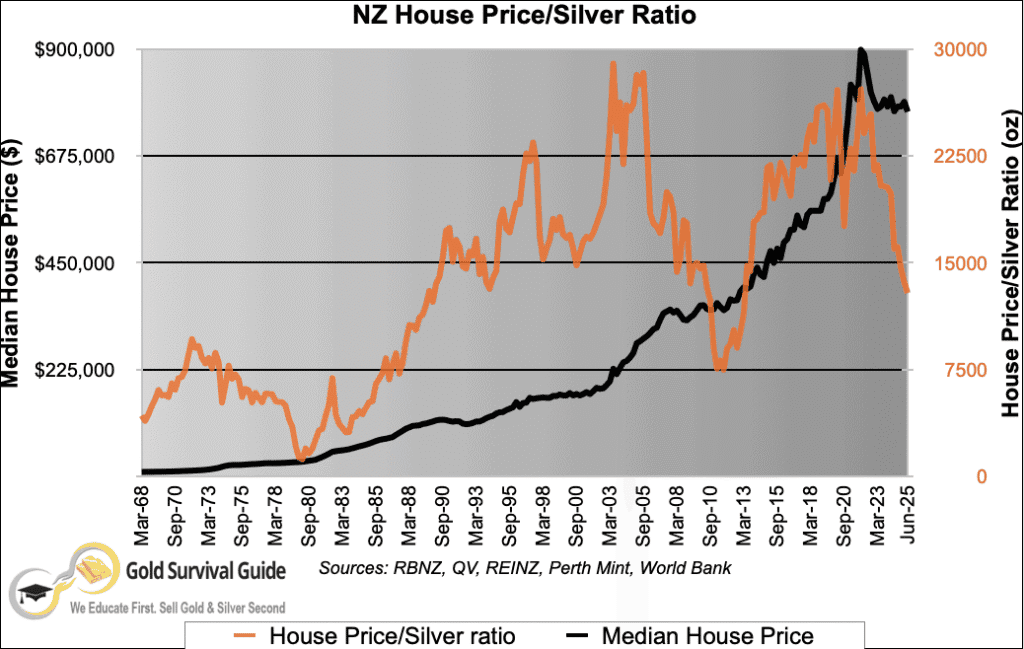
Chart Notes:
- The orange line shows the number of silver ounces needed to buy the median NZ house.
- The black line tracks the actual median house price in NZD.
- After peaking in recent years, the ratio has rolled over sharply — reflecting both rising silver prices and a cooling housing market.
What does it mean?
This sharp drop in the ratio means that silver has gained significant ground on property prices. In other words:
- Silver has outperformed real estate in the past year.
- Houses are now more affordable in silver terms than they’ve been in several years.
- It could be an early sign that silver is undervalued, or that housing prices are finding a ceiling — or both.
For long-term silver holders, it’s a reminder that silver may still have plenty of upside when measured against other hard assets like real estate.
Historical Trends & Extremes in NZ’s Housing to Silver Ratio
Below are the major turning points in New Zealand’s housing-to-silver ratio over the past five decades — showing where the extremes have occurred, and what drove them.
Key Turning Points in NZ’s Housing to Silver Ratio (Table)
| Period | Ratio (oz of silver) | What Happened |
|---|---|---|
| 1980 | ~1,100 | Silver spiked to all-time highs during the Hunt Brothers’ squeeze. You needed just over 1,000 oz of silver to buy a house — the cheapest housing has ever been in silver terms. |
| Early 2000s | ~7,000–12,000 | Housing prices began to climb steadily while silver remained depressed. Ratio steadily rose as real estate boomed and silver lagged. |
| 2004–2008 | ~20,000–25,000 | Housing prices surged during the global real estate boom. Silver prices were still low, pushing the ratio near record highs. |
| 2011 | ~3,300 | Silver’s price peaked during the post-GFC commodities rally. Ratio collapsed as silver gained sharply while house prices briefly stalled. |
| 2015–2019 | ~10,000–15,000 | Ratio hovered in mid-range territory. Silver was largely flat while house prices resumed their upward march. |
| 2020–2021 | ~27,000–30,000 | NZ housing surged post-COVID amid low interest rates and supply issues. Silver failed to keep up, pushing the ratio to new highs. |
| 2022–2024 | ~17,000 → ~16,000 | Silver began recovering while house prices plateaued. The ratio started trending downward. |
| 2025 | ~11,800 | With silver now above NZ$64/oz and house prices falling slightly, the ratio has dropped over 25% year-on-year — one of the sharpest declines in more than a decade. |
The above chart shows that at the end of the 1970’s precious metals bull market, it took around 1000 ozs of silver to buy the median New Zealand house (see the lowest point on the orange line).
To be specific, in March 1980 it took 1158 ounces. However our house price index data back then was only quarterly. The NZ silver price averaged $25.89 during March. Whereas the silver price peaked in January 1980 where it averaged $39.78. So this would have pushed the housing to silver ratio down under 1000 ounces.
Therefore anywhere close to 1000 ounces is likely to be a very good time to trade silver for property.
Cycles Repeat — Fast
These turning points show a clear pattern:
Silver stays quiet for years — then catches up quickly.
Each time the ratio peaked, silver reversed the trend in just a few years. And when silver has reclaimed value, the ratio collapsed by 70–90%.
We may be seeing that again in 2025 and beyond.
NZ House Price to Silver Ratio (Log Scale)
To better visualise the full range of this historical data, here’s the same ratio plotted on a log scale.
Log scales help highlight percentage-based moves, rather than raw point changes, and show just how massive past declines in the ratio have been.
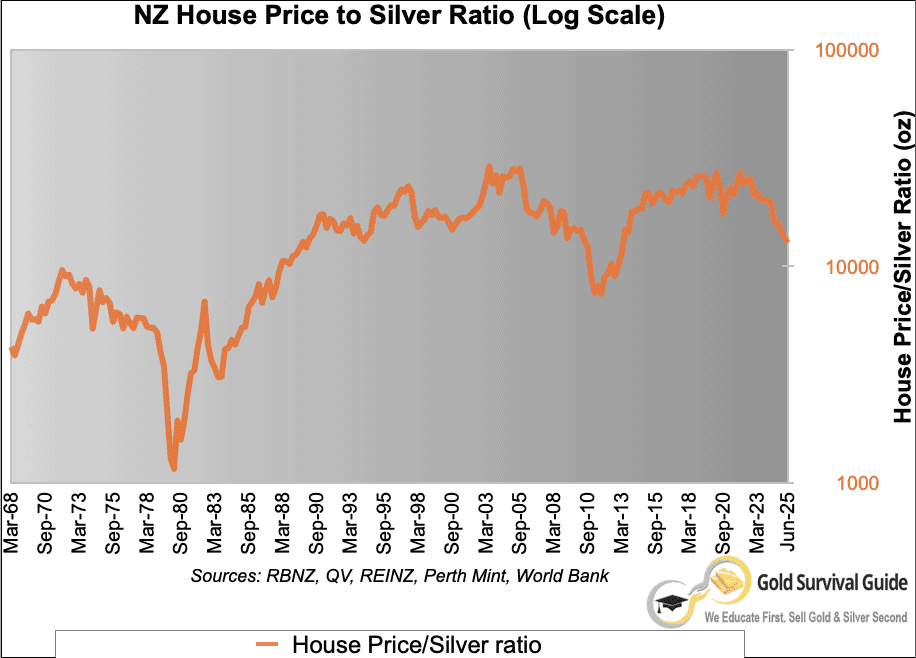
As you can see, even with silver’s recent rise and a drop in house prices, the current ratio (~11,800 oz) is still more than 10x higher than the extreme 1980 low near 1,000 oz.
While no one can guarantee silver will repeat history, the chart helps put today’s numbers in perspective. If the ratio were to return to even half its 1980 level, the potential upside for silver — relative to housing — would still be significant.
And if history does rhyme, we may still be early in the move.
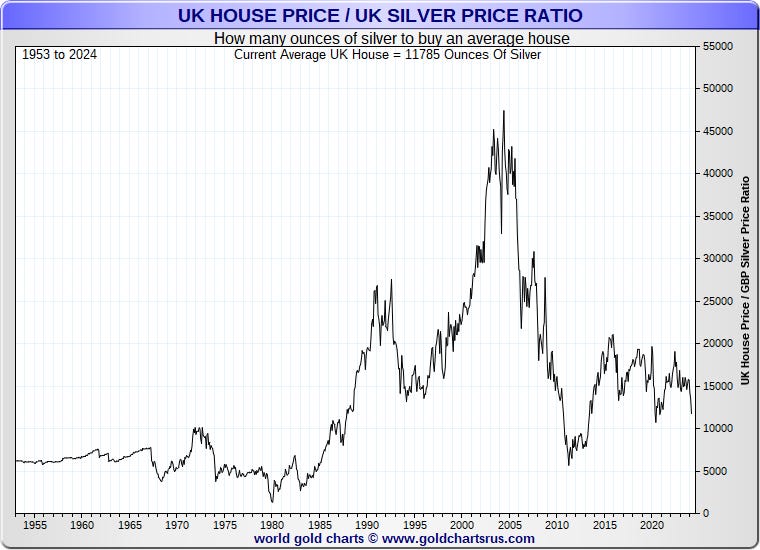
2025 Global Housing-to-Silver Ratio Comparison
Quick View Table (as of end of August 2025)
| Country | Avg House Price | Silver Price / oz | Ratio (oz of silver per house) |
|---|---|---|---|
| 🇬🇧 UK | £270,000 | £28.42 | ~9,500 oz |
| 🇺🇸 USA | US$422,400 | US$38.19 | ~11,060 oz |
| 🇳🇿 NZ | NZ$761,000 | NZ$64.71 | ~11,800 oz |
| 🇦🇺 Australia | A$848,858 | A$58.83 | ~14,400 oz |
🇬🇧 UK Summary
- Ratio: ~9,500 oz — lowest of the four countries
- Silver is relatively strong versus property
- Based on average house price data from July 2025
🇺🇸 USA Summary
- Ratio: ~11,060 oz — very close to NZ
- Median home price was US$422,400 in August 2025
- Silver has seen strong gains in USD terms over the past year
🇳🇿 NZ Summary
- Ratio: ~11,800 oz — down from ~17,000 in 2024
- Represents a 25%+ drop year-on-year
- Puts NZ in the middle of the pack globally in 2025
🇦🇺 Australia Summary
- Ratio: ~14,400 oz — highest among the four
- Housing remains relatively expensive in silver terms
- Based on August 2025 median price data

Note: This chart is from 2017, and newer data is limited — but it’s still useful to illustrate the shared historical trend across major housing markets.
Global Takeaway
Despite different currencies, policies, and property markets, the housing-to-silver ratio tells the same story around the world:
- Real estate rises gradually over decades…
- But when silver rallies, it can quickly regain lost value — sometimes by 80–90% or more in just a few years.
- This makes silver a powerful counterweight to property — and a useful lens for identifying long-term buying opportunities.
- The 1980 ratio low was around 1,000 ounces — in all 4 countries. So silver still has plenty of catching up to do against real estate globally.
Caveats to Consider:
- Comparability is imperfect: Figures vary due to differing data sources, currencies, property types, and whether median or average prices are used.
- Ratios reflect nominal house prices: Not adjusted for inflation, taxes, or other country-specific factors like ownership rates or borrowing conditions.
- Silver is volatile: Sudden changes in silver prices can swing these ratios sharply — this is a comparative, not predictive, tool.
Silver’s Potential Buying Power: What Could It Really Get You?
Sometimes ratios feel abstract. So let’s put it into simple numbers.
Imagine this:
As of September 2025, you could buy 1,158 ounces of silver for about $87,429 NZD (at $75.50/oz). That’s it.
If silver returned to its historical highs relative to housing (like in 1980 or 2011), those same 1,158 ounces could one day be traded for the median NZ house — currently worth $761,000.
That’s a house bought for less than $90K.
Buying a House with a 11.5% Silver Deposit?
Here’s another way to look at it:
Today you buy 1,158 ounces of silver for $87,429. That is 11.5% of the latest median house price of $761,000.
So make a 11.5% “down payment” today and in perhaps another say 5 years, be able to buy a whole house with your silver hoard.
For a deeper look at silver’s long-term upside, see our breakdown on What Price Could Silver Reach?

Conclusion & Key Takeaways
The Housing to Silver Ratio offers a unique lens on property prices — stripping away fiat currency noise and inflation to show the real, tangible value of homes in terms of silver.
Right now, in 2025, that lens is showing something pretty interesting:
- The ratio has dropped sharply in the last 12 months — from 17,000 ounces to 11,800
- That’s one of the biggest year-on-year moves in silver’s favour in over a decade
- Compared globally, NZ housing is now cheaper in silver terms than both the USA and Australia
- And silver is still well below its historical highs — with room to move if sentiment shifts
Quick Takeaways
✅ Ratio down from 17,000 to 11,800 ounces in 12 months
✅ Largest year-on-year drop in over a decade
✅ Silver still below historical highs — room to run
✅ NZ ratio now lower than USA, and Australia
✅ History shows silver catches up fast when it moves
Want to Be Ready When Silver Makes Its Move?
If history is any guide, silver’s periods of undervaluation don’t last forever.
We’re seeing signs that silver may once again be setting up for a major revaluation — and when that happens, it can reprice fast. Whether you’re interested in preserving your wealth, diversifying out of property, or even positioning for opportunity, owning physical silver could play a key role.
Ready to start stacking silver? Visit our guide on How to Buy Gold & Silver Coins or Bars in NZ to get started.
At Gold Survival Guide, we make it simple:
- Buy physical silver bullion — securely stored or delivered
- Private, audited storage options available
- Trusted by Kiwis since 2010
- Education-first approach (we’ll never “sell” you — we’ll inform you)
Want help getting started? Contact us here or call us on 0800 888 465
Or check today’s silver pricing and order securely online: View Prices.
FAQs: Housing to Silver Ratio Explained
People also search for:
- How many ounces of silver does it take to buy a house?
- Housing to silver ratio NZ / USA / UK / AUS
- House prices in silver
- Silver vs real estate investment
- Silver vs property prices 2025
- What is the housing-to-silver chart telling us?
It tells you how many ounces of silver it would take to buy a house — usually based on the median or average property price. It’s a way to compare real estate value vs silver over time, cutting through inflation and currency fluctuations.
As of August 2025:
– Median NZ house: $761,000
– Silver price: $64.71/oz
– Ratio: ~11,800 ounces
That’s down 25% from last year — one of the sharpest drops in over a decade.
– In 1980, the ratio hit historic lows — under 1,000 ounces in many countries.
– In 2021, NZ peaked near 30,000 ounces.
– Since 2021, silver has been quietly regaining ground — especially in 2025.
The long-term pattern? Housing booms, silver plays catch-up in sharp bursts.
As of 2025, NZ’s housing-to-silver ratio is ~11,800 oz, placing it between the UK (~9,500 oz), USA (~11,060 oz), and Australia (~14,400 oz). NZ ranks mid-range globally, showing silver has gained ground vs housing.
To work it out:
– Use the median house price if available (average is OK too).
– Use spot silver price per ounce in the same currency.
– Then divide the house price by silver price.
Example:
– NZ median house price = NZ$761,000
– Silver price = NZ$64.71
– Ratio = 761,000 ÷ 64.71 = ~11,760 ounces
That means you’d need nearly 11,800 ounces of silver to buy a median house in NZ today.
Because silver is a monetary constant. While dollars and property values fluctuate, silver lets you:
– Track true long-term affordability
– Spot buying opportunities
– See when silver is undervalued vs hard assets
It’s a powerful way to step outside the fiat system and look at real value.
Editors Note: This post was first published 29 March 2011. Fully updated 24 September 2025. With new charts, numbers and content.
{ “@context”: “https://schema.org”, “@type”: “Article”, “mainEntityOfPage”: { “@type”: “WebPage”, “@id”: “https://goldsurvivalguide.co.nz/nz-housing-to-silver-ratio/” }, “headline”: “NZ House Price / Silver Ratio”, “description”: “How many ounces of silver would it take to buy a house in NZ? See the updated housing-to-silver ratio chart from 1968–2025, plus global comparisons, FAQ, and key insights for silver stackers.”, “author”: { “@type”: “Person”, “name”: “Glenn Thomas”, “url”: “https://goldsurvivalguide.co.nz/gold-silver-blog/author/glenn-thomas” }, “publisher”: { “@type”: “Organization”, “name”: “Gold Survival Guide”, “logo”: { “@type”: “ImageObject”, “url”: “https://goldsurvivalguide.co.nz/wp-content/uploads/2017/09/logo-small-v6.png” } }, “datePublished”: “2011-03-29”, “dateModified”: “2025-09-24”, “about”: [ “Silver”, “NZ Housing Market”, “Silver to House Ratio”, “Precious Metals”, “Gold”, “Real Estate”, “Monetary History”, “Property Prices”, “Inflation”, “Gold/Silver Ratio”, “Housing Affordability”, “Silver Ounces”, “NZD”, “USD”, “GBP”, “Australian housing”, “UK Housing”, “US Housing”, “Fiat Currency”, “Commodity Cycles”, “1970s Inflation”, “2011 Silver High”, “Gold-Silver Ratio” ], “mentions”: [ “Silver”, “Gold”, “New Zealand”, “UK”, “USA”, “Australia”, “RBNZ”, “ASB”, “Reserve Bank of New Zealand”, “Gold Survival Guide”, “NZD”, “USD”, “GBP” ], “image”: [ { “@type”: “ImageObject”, “name”: “NZ Housing to Silver Ratio Chart (1968–2025)”, “description”: “Line chart showing the number of ounces of silver needed to buy the median NZ house from 1968 to 2025.”, “contentUrl”: “https://goldsurvivalguide.co.nz/wp-content/uploads/2024/11/nz-house-price-to-silver-ratio-1968-2025.webp”, “datePublished”: “2025-09-24”, “license”: “https://goldsurvivalguide.co.nz/disclaimer/”, “acquireLicensePage”: “https://goldsurvivalguide.co.nz/contact/”, “copyrightNotice”: “© 2025 Gold Survival Guide”, “creditText”: “Gold Survival Guide”, “creator”: { “@type”: “Organization”, “name”: “Gold Survival Guide” }, “copyrightHolder”: { “@type”: “Organization”, “name”: “Gold Survival Guide” } }, { “@type”: “ImageObject”, “name”: “UK Housing to Silver Ratio Chart”, “description”: “Historical chart showing the average UK house price in ounces of silver, highlighting ratio peaks and lows.”, “contentUrl”: “https://goldsurvivalguide.co.nz/wp-content/uploads/2024/11/uk-house-price-to-silver-ratio-chart.jpg”, “datePublished”: “2025-09-24”, “license”: “https://www.goldchartsrus.com/subscription.php”, “acquireLicensePage”: “https://www.goldchartsrus.com/contact.php”, “copyrightNotice”: “Chart © GoldChartsRUs”, “creditText”: “GoldChartsRUs”, “creator”: { “@type”: “Organization”, “name”: “Gold Survival Guide” }, “copyrightHolder”: { “@type”: “Organization”, “name”: “GoldChartsRUs” } }, { “@type”: “ImageObject”, “name”: “US Housing to Silver Ratio Chart”, “description”: “US house price to silver ratio from the 1970s to 2024, showing major peaks and collapses in silver affordability.”, “contentUrl”: “https://goldsurvivalguide.co.nz/wp-content/uploads/2024/11/us-house-price-to-silver-ratio-chart.jpg”, “datePublished”: “2025-09-24”, “license”: “https://www.goldchartsrus.com/subscription.php”, “acquireLicensePage”: “https://www.goldchartsrus.com/contact.php”, “copyrightNotice”: “Chart © GoldChartsRUs”, “creditText”: “GoldChartsRUs”, “creator”: { “@type”: “Organization”, “name”: “Gold Survival Guide” }, “copyrightHolder”: { “@type”: “Organization”, “name”: “GoldChartsRUs” } }, { “@type”: “ImageObject”, “name”: “Australia Housing to Silver Ratio (1975–2017)”, “description”: “Chart showing Australian house prices measured in silver ounces, highlighting the 1980 and early 2000s peaks.”, “contentUrl”: “https://goldsurvivalguide.co.nz/wp-content/uploads/2024/11/Australia_Silver_vs_House_Prices_1975_-_2017_SDBullion.com_silver_vs_home_prices_vs_silver_Australia.webp”, “datePublished”: “2025-09-24”, “license”: “https://www.goldchartsrus.com/subscription.php”, “acquireLicensePage”: “https://www.goldchartsrus.com/contact.php”, “copyrightNotice”: “Chart © GoldChartsRUs”, “creditText”: “GoldChartsRUs”, “creator”: { “@type”: “Organization”, “name”: “Gold Survival Guide” }, “copyrightHolder”: { “@type”: “Organization”, “name”: “GoldChartsRUs” } }, { “@type”: “ImageObject”, “name”: “NZ Housing to Silver Ratio – Linear Chart”, “description”: “Linear scale chart tracking New Zealand house prices in ounces of silver from 1968 to June 2025.”, “contentUrl”: “https://goldsurvivalguide.co.nz/wp-content/uploads/2024/11/NZ-Housing-to-Silver-Ratio-chart-1968-to-June-2025.png”, “datePublished”: “2025-09-24”, “license”: “https://goldsurvivalguide.co.nz/disclaimer/”, “acquireLicensePage”: “https://goldsurvivalguide.co.nz/contact/”, “copyrightNotice”: “© 2025 Gold Survival Guide”, “creditText”: “Gold Survival Guide”, “creator”: { “@type”: “Organization”, “name”: “Gold Survival Guide” }, “copyrightHolder”: { “@type”: “Organization”, “name”: “Gold Survival Guide” } }, { “@type”: “ImageObject”, “name”: “NZ Housing to Silver Ratio – Log Chart”, “description”: “Logarithmic scale chart showing the silver-to-house price ratio in New Zealand, emphasizing proportional declines.”, “contentUrl”: “https://goldsurvivalguide.co.nz/wp-content/uploads/2024/11/NZ-House-Price-to-Silver-Ratio-Log-Scale.png”, “datePublished”: “2025-09-24”, “license”: “https://goldsurvivalguide.co.nz/disclaimer/”, “acquireLicensePage”: “https://goldsurvivalguide.co.nz/contact/”, “copyrightNotice”: “© 2025 Gold Survival Guide”, “creditText”: “Gold Survival Guide”, “creator”: { “@type”: “Organization”, “name”: “Gold Survival Guide” }, “copyrightHolder”: { “@type”: “Organization”, “name”: “Gold Survival Guide” } }, { “@type”: “ImageObject”, “name”: “NZ Housing to Silver Ratio – Log Chart with Projection”, “description”: “NZ housing-to-silver ratio with log scale and projection to prior lows near 1,000 ounces, highlighting downside potential.”, “contentUrl”: “https://goldsurvivalguide.co.nz/wp-content/uploads/2024/11/NZ-House-Price-to-Silver-Ratio-Log-Scaleprojection.png”, “datePublished”: “2025-09-24”, “license”: “https://goldsurvivalguide.co.nz/disclaimer/”, “acquireLicensePage”: “https://goldsurvivalguide.co.nz/contact/”, “copyrightNotice”: “© 2025 Gold Survival Guide”, “creditText”: “Gold Survival Guide”, “creator”: { “@type”: “Organization”, “name”: “Gold Survival Guide” }, “copyrightHolder”: { “@type”: “Organization”, “name”: “Gold Survival Guide” } } ] }
Glenn's dedication to educating individuals on wealth protection through precious metals has helped over 2400 clients from New Zealand, Australia, USA and Europe to safeguard their financial futures. Passionate about financial independence and lifestyle freedom, Glenn’s mission is to empower others with the knowledge and tools to thrive in today’s volatile economic environment. When he's not advising on precious metals, Glenn enjoys spending time with his family and pursuing outdoor adventures.
Education: University of Auckland Bachelor of Science
Linkedin: https://www.linkedin.com/in/glenn-thomas-0984a4310/
Pingback: Price It In GOLD And SILVER Before You Believe What You Hear About Global Stock Market Recoveries | Gold Prices | Gold Investing Guide
Pingback: Housing Un-affordability: It’s Not Supply, It’s the Debt Stupid! | Gold Prices | Gold Investing Guide
Pingback: Should I sell my home and buy precious metals? | Gold Prices | Gold Investing Guide
Pingback: Will NZ Banks Buy Gold? | Gold Prices | Gold Investing Guide
Pingback: Exit Strategies For When the Time Comes to Sell Gold and Silver | Gold Prices | Gold Investing Guide
Pingback: What Good is a Bar of Gold When the Shelves are Empty? - Gold Prices | Gold Investing Guide
Pingback: Wages from Ancient Greece and NZ Housing Both Say Silver Undervalued by a Factor of 20 - Gold Survival Guide
Pingback: Gold and Silver Technical Analysis: The Ultimate Beginners Guide - Gold Survival Guide
Pingback: NZ Housing to Gold Ratio 1962 - 2019: Measuring House Prices in Gold
Pingback: Wages from Ancient Greece and NZ Housing: Both Say Silver Undervalued by a Factor of 20 - Gold Survival Guide
Pingback: How Do Chinese Thought Leaders See the Monetary System Changing? - Gold Survival Guide
Pingback: Why Buy Gold? No Fiat Currency Lasts Forever - Even the NZ Dollar. Devalued 7 Times in 17 Years... - Gold Survival Guide
Pingback: NZ Government Bonds Go Negative - A Taste of What’s to Come - Gold Survival Guide
Pingback: Does the NZ Government Debt Matter? - Gold Survival Guide
Pingback: Record Gold Imports into New Zealand as Investors Seek Haven - Gold Survival Guide
Pingback: Will New Zealand Property Prices Ever Fall? - Gold Survival Guide
Pingback: What Percentage of Gold and Silver Should Be in My Portfolio? [2021 Update] - Gold Survival Guide
Pingback: If New Zealand Introduces a Central Bank Digital Currency, How Will Gold or Silver Be Valued and How Will One Use Them? - Gold Survival Guide
Pingback: Recession Coming? A Repeat of 1973-74? - Gold Survival Guide
Pingback: Weather, Inflation and a Wage/Price Spiral - Gold Survival Guide
Pingback: What Will the Long Term Impacts of SVB and Signature Bank Bailouts Be? - Gold Survival Guide
Pingback: Gold vs Collectibles: Should I Sell My Vintage Car and Buy Gold if Inflation is Coming?