See how high the silver price could go. In this article you’ll discover a number of methods to reach a potential valuation for silver in the coming years including:
- Extrapolating out using the gold to silver ratio
- Inflation adjusted silver price
- A projected price of silver using the Dow to silver ratio
Table of contents
- Gold Price Projections
- Question: “When would we likely see 25000 USD per ounce of gold?”
- Question: “What is your prediction of the silver price?”
- What about Silver Price Projection in NZ Dollars?
- Inflation Adjusted Silver Price
- A Future Projected Price of Silver Using the Dow to Silver Ratio
- Summary: Projecting a High for the Silver Price
Estimated reading time: 7 minutes
Gold Price Projections
A previous video of ours looked at the question – Is it Too Late to Buy Gold?
We reviewed a number of ways to project a possible gold price based upon various valuation methodologies.
One of these was the Gold Backing to Debt Ratio.
This method looked at the total US debt versus US national gold holdings. It suggested that if history repeats, we could see a US$25,000 gold price.
Read more: Gold Backing to Debt Ratio: A Reset Like in 1934 and 1980 Would Mean $25,000 Gold
Here’s a number of questions we’ve received as a result of this gold price projection…
Question: “When would we likely see 25000 USD per ounce of gold?”
The “when” is very difficult to even guess at. Coming up with projected prices is much easier than picking a timeline for them to occur. It’s a fool’s errand to even try…
But why not be foolish every now and then!? In this article we make an argument that gold could reach full valuation somewhere around 2026-2030: Gold Cycles vs Property Cycles: When Will Gold Reach Peak Valuation?
Given that silver generally follows gold, it’s likely that silver will peak towards the end of the precious metals bull market. Potentially even just after gold does. So likely still some years away yet. But when silver does peak, how high could the silver price go?
Question: “What is your prediction of the silver price?”
Another question from the same person. What’s our prediction for the silver price?
Well, one method is to extrapolate out using the gold to silver ratio.
The gold to silver ratio currently sits at around 85. Meaning it takes 85 ounces of silver to buy an ounce of gold. Down from the all time record highs in 2019.
Read more: What is the Gold Silver Ratio? What are New Highs in the Ratio Telling Us?
Let’s say the gold to silver ratio fell back to around 50 (although history also says that it will likely go lower by the end of the cycle). Then a projected US$25,000 gold price divided by 50 would equate to US$500 per ounce for silver.
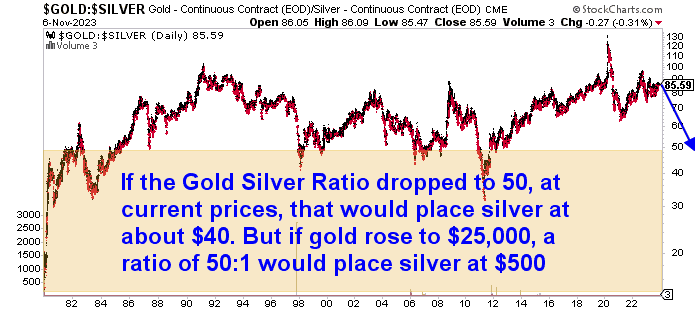
Now, that may sound a bit crazy, but there is a historical precedent for it. You can see in the chart above that the gold to silver ratio has been below 50 many times since the early 80’s.
What about Silver Price Projection in NZ Dollars?
A great bunch of questions from Stacey on our facebook page:
“Is it reasonable to calculate a potential future ‘price’ for silver by taking the NZ$40k+ price of gold and guestimating a 1:40 gold/silver ratio? Could the gold/silver ratio over correct and push the price of silver even higher? What’s the historical precedent for say a 1:12 ratio?”
Stacey is converting the above US$25,000 gold price projection into New Zealand dollars (using an exchange rate of around 0.60). Resulting in a projected NZ Dollar gold price of just over $40,000.
Then she has used a slightly lower gold to silver ratio number of 40, compared to the 50 that we used above. Therefore a projected gold price of NZ$40,000 divided by 40 = $1000 per ounce silver price.
So is that a reasonable projection to make?
Yes that could be reasonable. Given the gold to silver has been at 40 many times in the past (as shown in the above chart).
Question: “Could the gold/silver ratio over correct and push the price of silver even higher? What’s the historical precedent for say a 1:12 ratio?”
And yes there is also a historical precedence for a ratio below 20. It happened 3 times last century. See the historical chart below from our recent gold ratios update. The last occasion was at the end of the 1970 precious metals bull market in 1980.
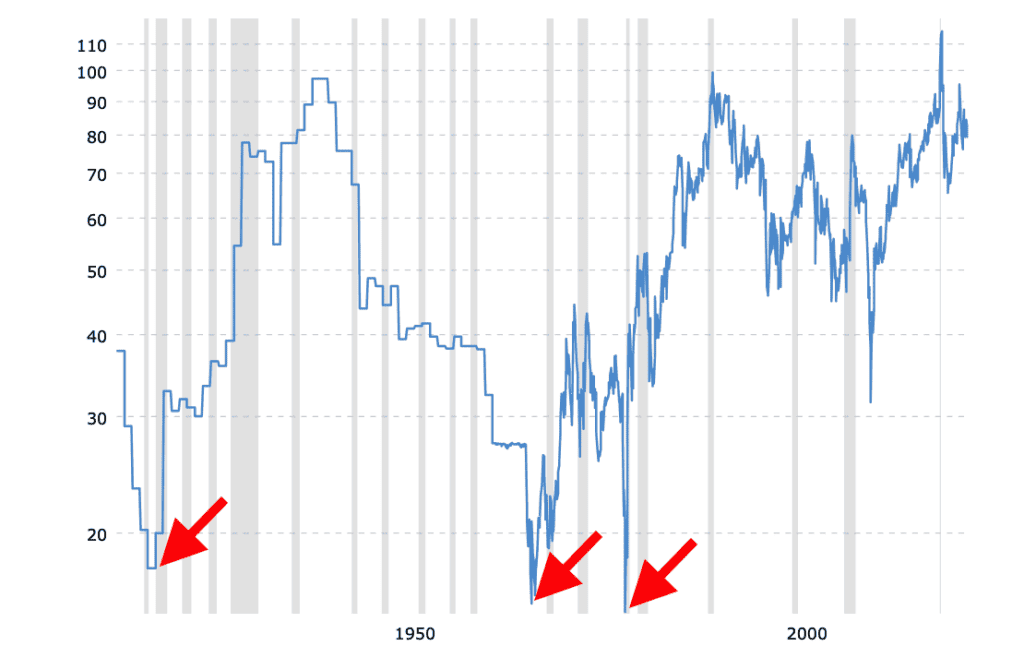
Using Stacey’s suggested ratio of 12 would put the NZ projected silver price at an astounding $3333! That seems completely impossible when compared to the current price of around NZ$39.
But again it would simply be the past repeating. So it may be far-fetched, but not impossible when using history as our guide.
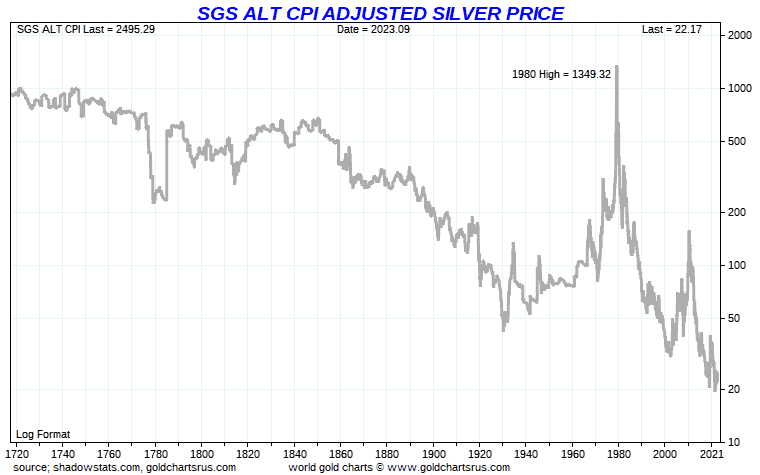
Inflation Adjusted Silver Price
Here’s a little known fact that demonstrates the upside potential for silver.
Silver is about the only financial asset or commodity we can think of, where it still hasn’t bettered it’s high from 1980 of US$50 per ounce.
But if we adjust the silver price for inflation using the Consumer Price Index (CPI), it shows silver has even more ground to make up. The 1980 high is now US$166.02. Or over 7 times higher than the current price of US$23.00.
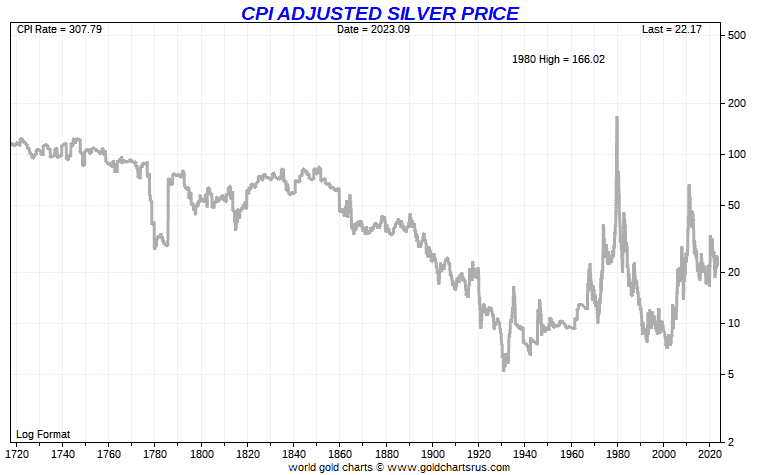
Then, using the Shadow Government Statistics (SGS) numbers this goes up even further. SGS uses CPI methodology from back in the 1980’s to give a potentially truer indication of inflation than the often adjusted and substituted official government numbers. The price to match the 1980 high is now US$1349.32. Or over 58 times higher than today’s price!
A Future Projected Price of Silver Using the Dow to Silver Ratio
Here’s another way to value silver. Using the Dow to Silver Ratio. This measures the US stock market (by way of the Dow Jones Industrial Average) against silver. Resulting in the number of ounces of silver to “buy” the Dow Jones Index.
The chart below plots this ratio of US stocks to silver over the last 200 years. The Dow/Silver as of today sits at 1482:1 (1482 ounces of silver to buy the Dow Jones Index: 34,095 divided by $23). At the peak of the last precious metals bull market in 1980, the ratio hit a low of 17:1. If the ratio were again to hit that mark, this would be a fall for US stocks of 98.85% against silver.
Should the Dow Jones stay exactly where it sits today, at around 34,000 (unlikely), then silver would have to rise to US$2000 to match the 1980 low in the Dow to Silver ratio of 17:1.
The chart also plots that potentially the ratio will head even lower. Down to around 6:1.
At today’s share prices that would equate to a silver price of just over US$5667! Or let’s imagine the Dow dropped 50% from today’s prices. Not an impossibility, as this has happened numerous times previously. That would take the Dow index down to around 17,000. A 6:1 ratio would therefore put silver at $2833.

Summary: Projecting a High for the Silver Price
So here are the projected silver prices using the various methodologies above (note that some are in USD and some are in NZD):
- Gold to silver ratio falling to around 50 and using a projected US$25,000 gold price = US$500 /oz
- Projected gold price of NZ$40,000 divided by a gold to silver ratio of 40 = NZ$1000 per ounce
- Projected gold price of NZ$40,000 divided by a gold to silver ratio of 12 = NZ$3333 per ounce
- Inflation Adjusted 1980 high Silver Price using official CPI = US$166.02
- Inflation Adjusted 1980 high Silver Price using SGS inflation = US$1349.32
They vary from US$166 all the way up to NZ$3333. Of course a good argument could be made that some of the above projections for how high silver could rise are pretty out there.
But by any measure silver is very undervalued today. Whether that be against gold, against shares or stocks or against historical dollar prices.
All these methods for placing a possible future price on silver have one thing in common…
The prices are all significantly higher than today’s price.
Even the lowest projection, using inflation adjusted prices, is 7 times higher than the current price.
Gold may be in the early stages of a larger move higher. Generally silver follows gold, often later but higher. That would make right now a pretty decent time to buy silver. What do you think? Leave us a comment below if you can think of another way to project a future silver price…
Editors Note: This post was originally published 27 May 2020. Updated 7 November 2023 to include all updated projections.
Pingback: Clarification on Negative Interest Rates - Gold Survival Guide
Pingback: Why RBNZ Q.E. Will Increase the Gap Between the Haves and Have Nots - Gold Survival Guide
Pingback: RBNZ QE Ahead of Plan - Chart Proves There’s More to Come - Gold Survival Guide
Pingback: Could Silver Be Worth More Than Gold? - Gold Survival Guide
Pingback: Will Silver Repeat Mid 70’s and Mid 00’s Break Out? - Gold Survival Guide