The concept of long term cycles and how history at least rhymes, if not repeats, is a topic we find really interesting. If somewhat hard to explain exactly why these cycles repeat.
In 2017 we contemplated whether the new NZ government policies would cause a house price crash. Also whether NZ house prices had reached a cyclical peak. That article got us thinking more about long term cycles in the real estate market. Plus also gold cycles and how they compare to property cycles.
This article covers:
Estimated reading time: 12 minutes
Did NZ Property Peak in 2017?
In our 2017 article we commented that we thought New Zealand house prices had likely reached a cyclical peak:
Cyclical Peak in NZ House Prices
Our guess is that perhaps we have reached a cyclical peak in house prices in New Zealand (especially in Auckland).
But large corrections and house price crashes usually come after rampant speculation and very loose lending standards. (Think the USA housing bubble in 2007 and “liar loans”). Whereas here in New Zealand (flowing over from the tightening in Australia around banks capital adequacy requirements), financing has actually gotten very tight in recent months.
So that doesn’t really gel with a super bubble in house prices.
Perhaps we will just see a flattening of house prices here in New Zealand in the coming years, as many property experts are calling for? Maybe a mega bubble top and major house price crash is still to come down the line further yet?
See the full article here: A House Price Crash Caused By the New NZ Government Policies?
2021 Update on New Zealand and Auckland House Median Prices
How have house prices tracked since the above was written in October 2017?
Until early 2020, the Auckland median house price was down from the peak at $900,000 in March 2017. It was only in March 2020 that we saw a large jump up to $940,000. So there had been a definite flattening out since the 2017 peak.
Last May we thought it was reasonable to expect a dip lower as a result of the fallout from the COVID lockdown.
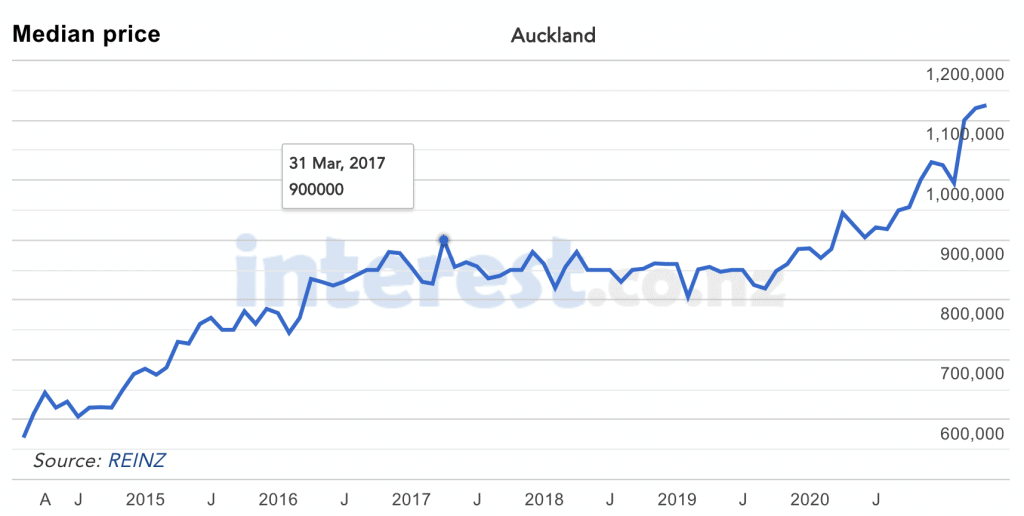
Source. Interest.co.nz
Conversely after dipping back to $550,000 at the start of 2019, the New Zealand median house price had been rising again. It peaked at $680,000 in April 2020.
Then the COVID19 lockdown induced slow down we expected occurred – but only briefly in May 2020. After that it was off to the races again for residential real estate.

Source: Interest.co.nz
In May 2020 we said:
“So it wouldn’t be a surprise to see a flattening out of house prices in New Zealand. A full crash? Maybe not so likely with all the interventions the government and reserve bank have rolled out in recent months. This cheap money could help to keep prices up.”
That has certainly been the case. Except there was so much cheap money that prices have actually even been boosted higher.
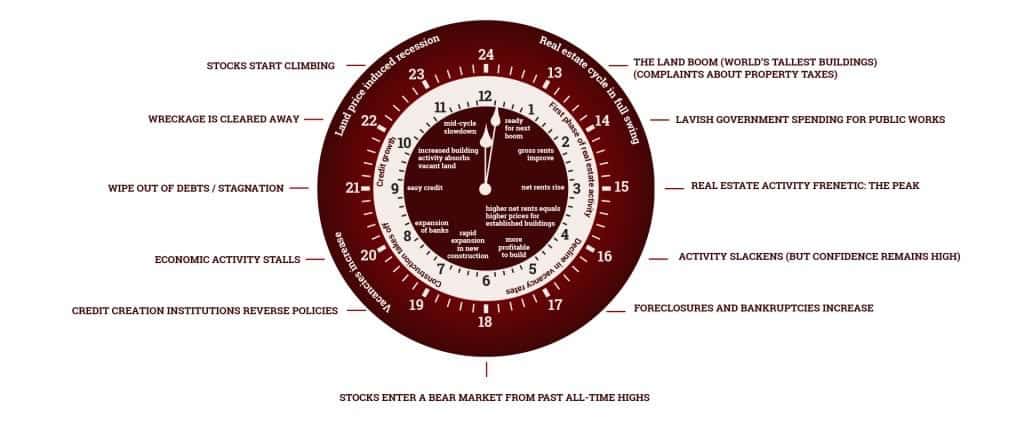
The 18 Year Real Estate Cycle or “Property Clock”
In our 2017 article, we talked about the possibility of a “mega bubble” to come. This “mega bubble” fits with the interesting ideas of Australian Phil Anderson. He has an 18 year real estate cycle or “property clock”. He writes:
“One of the major topics I’ve spent studying over the last thirty years is what I call the 18 year real estate cycle. It’s a regular pattern that’s repeated throughout over 200 years of US history, and even longer in the UK.
This makes the economy a lot more predictable than most people assume. It also gives you incredible insight into which sectors you should be trading.
It gives you a valuable timing guide when to be in and out of asset markets. I was 100% in cash during the GFC thanks to this pattern.
US real estate bottomed out in 2011. Real estate cycle history suggests we’ll get an overall 14-year up move in US real estate until around 2024/5. Then we’ll get another collapse around 2026 like 2008. The boom-bust cycle comes from the property market.
I can tell you one thing. The real estate cycle continues to turn. It’s all happening right before our eyes, and as per my Cycles, Trends and Forecasts property clock.”
Phil Anderson’s cycles work stems from the idea that all economic progress is capitalised into land values. Any technological gain increases the price of land, rather than actually leading to increased standards of living for everyone. As does any infrastructure improvements.
It’s what is called the “economic rent”. Which we all pay through higher land and therefore housing prices. Interesting stuff taken mainly from an old guy from the 1800’s by the name of David Ricardo. While his ideas in cycles are from another not quite so – but still old – guy, W.D. Gann.
So to summarise this 18 year property clock cycle it is:
- 7 good years
- 1 negative year
- 7 good years
- 3.5 negative years
Therefore the current cycle would be:
- Negative years (3.5 down) 2008 (GFC) + 3.5 = late 2011
- Growth years (7 up or sideways) 2011 + 7 = 2018
- Negative Year (1 down) 2018 +1 = 2019
- Growth years (7 up or sideways) 2019 + 7 = 2026
- Next big crash (3.5 down) 2026 + 3.5 = 2030
This cycle is for the USA. With the idea being that generally the USA leads the rest of the world.
Of course you’ll also find plenty arguing against this theory. Here’s someone arguing the real estate clock does not work in Australia: The 18 Year Real Estate Clock Myth
But as this cycle is based upon the US economy, it acts more as a guide. Different parts of the world will rise more than others. Therefore they will fall at slightly different times too. But he argues the US still remains the main driver of the cycle.
Now that we’ve had a year pass since the COVID19 outbreak, this cycle is looking pretty accurate. Therefore, will property prices continue to rise from now until 2026?
Gold Cycles
Next let’s take a look at gold cycles and see how the current cycle in gold and silver compares to the previous bull market.
Gold Cycles: Gold Bull Market 1970’s vs 2000 to Date
Ronni Stoeferle’ 2017 chartbook had an excellent chart comparing the 1970’s bull market in gold with the bull market since 2000.
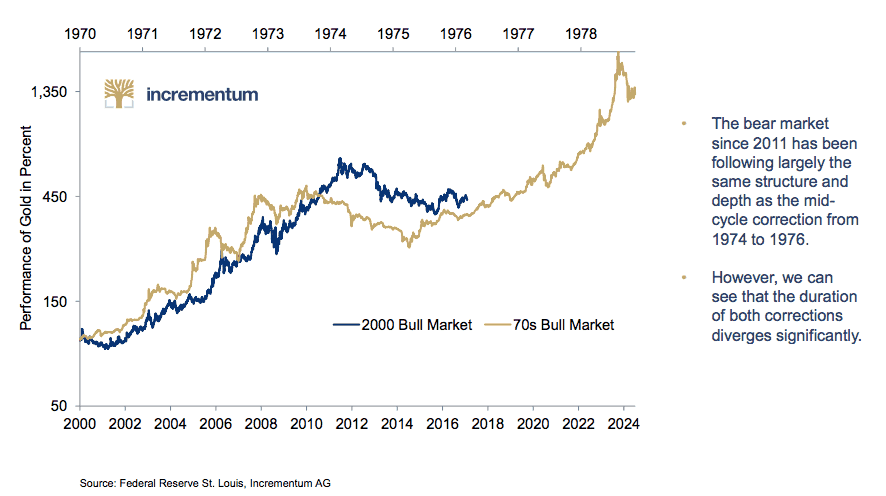
See the full In Gold We Trust 2017 chart book here.
It’s important to note that the time scales are very different on these 2 periods. Nevertheless, the path the current bull market in gold is following, looks very similar in shape to that of the 1970’s. Here’s how…
The 1970’s Gold Bull Market Cycle
The 1970’s gold bull market saw the gold price rise from 1970 through until 1974. Then there was a correction that lasted almost 2 years. Before gold then powered higher for the remainder of the decade.
The Gold Bull Market Cycle Since 2000
Compare the 70’s to the current gold bull market cycle and there are some interesting similarities.
- The current bull market has been roughly double that of the 1970’s in terms of time.
- It saw a rise from 2001 to 2011. This was 10 years or roughly double the 4 year rise of the early 1970’s.
- Then the correction from 2011 to late 2015 lasted just over 4 years. Again around double the 1970’s almost 2 year correction.
Now look at the rises in percentage terms.
From the 2001 low up until June 2019, gold had risen about 560% ($250 to $1400). Comparing this to the 1970’s, this is similar to the rise up until 1977.
When Will Gold and Silver Reach their Peak Valuations?
We don’t think it’s too over the top to assume that there is still another leg higher to come in this gold and silver cycle. If precious metals follow a similar script to the 1970’s, that would mean a further 5 years or so of higher prices to come for gold.
Where Might the Gold Price End Up at the End of This Cycle?
Gold began the 1970s at US$35 an ounce. It reached US$850 in 1980. So an increase of almost 25 times.
Whereas gold began the current bull market cycle at US$250 an ounce. A 25-fold increase would give us an eventual target of US$6,250.
However the final “price” will likely depend on just how many new currency units (dollars, pounds, euros, reminbi) are created in the next number of years. With the way things are going this next leg of the gold bull market could make the later half of the 1970’s pale in comparison.
Read more: How Do You Value Gold | What Price Could it Reach?
The 14 Year Property Cycle and the Current Precious Metals Cycle
How does the current 14 year property cycle gel with our thoughts on the possible current precious metals cycle we are in?
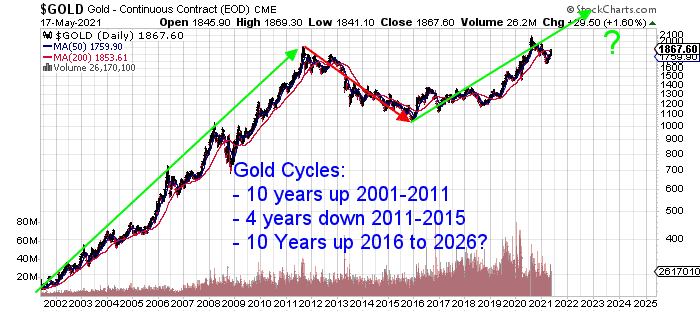
As explained above the current gold bull market has looked like this:
- 10 years up 2001 to 2011
- 4 years down 2011 to 2015
- Still in progress: 10 Years up 2016 to 2026???
This would line up with Phil Anderson’s projected mega peak in property around 2026 and the mega crash/crisis to follow through to around 2030. Although this will likely be on an even bigger scale than the 2008 crisis. Why? Because there will be much more debt required to inflate the property bubble all the way until 2026!
Gold could then reach peak valuation against property around 2030. Even if gold also fell a bit after 2026, perhaps it would not fall as much as property?
Or perhaps a gold revaluation (See: Does a Gold Revaluation to US$10,000 With All Major Countries Make Sense?) or remonetisation of gold could cause gold to remain at heightened levels rather than falling after 2026?
Sovereign Default Cycles and Gold
Here’s another very interesting comparison that shows a similar timescale for a coming sovereign default crisis. We received this in an email from Kerry Stevenson who runs the Gold and Alternative Investments Conference (GAIC) in Australia. An event we’ve attended many times over the years.
Daniel Want was a keynote presenter at the 2019 GAIC. His presentation was on “The Next Sovereign Default Cycle”.
His “Sovereign Default Cycle” peak in the “mid 2020s” correlates very closely in timing to the property and gold peaks we’ve already discussed:
In our upcoming Presentation we are going to try to anticipate the timeframes we may be looking at for the peaks of two key cycles, the first being the private-sector asset impairment cycle, the second being the broader sovereign-default cycle.
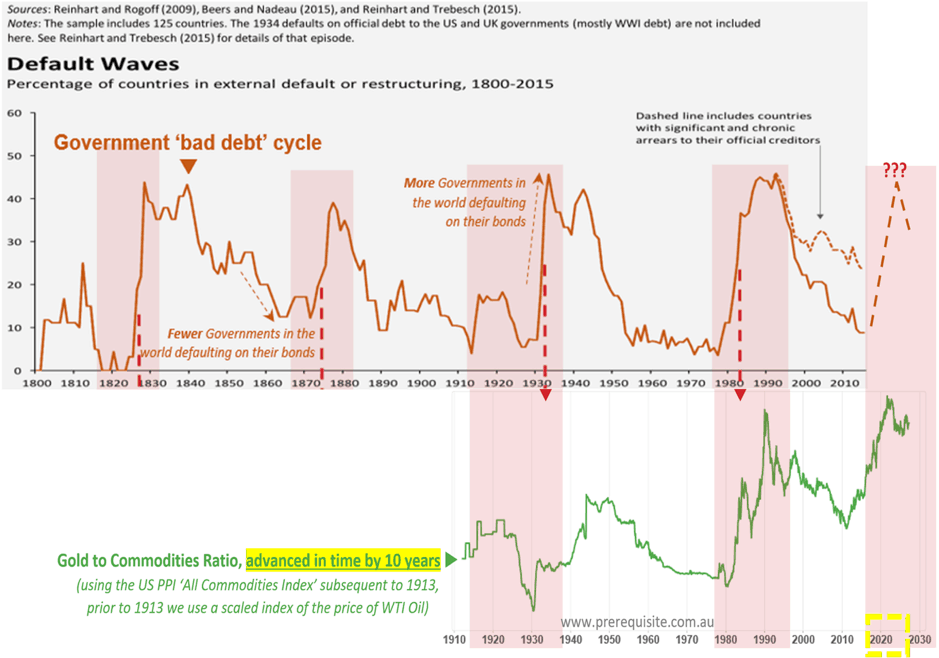
When thinking about how we might gain some ‘leading cyclical insight’ into the Global Sovereign Default Cycle (using Reinhart & Rogoff’s chart below), we realised at a first-principles level that ‘in theory’ conditions that give rise to Sovereign Default Risks are reasonably observable by many different participants well in advance of any actual Sovereign Default occurring for a country.
Therefore, somewhat in keeping with Exter’s inverted pyramid capital flow theory, you should be able to see money start progressively heading for the safety of Gold ahead of when the Sovereign Defaults started to manifest themselves.
When we had a look at the data (by ‘deflating’ Gold by Commodity prices thereby seeing the ‘real demand’ or ‘real price’ of Gold) it was no surprise to see almost a near-perfect 10 year leading relationship of the ratio of Gold to Commodities (see green line in below chart).
This mode of analysis would suggest the next Global Sovereign Default Cycle is likely to peak in the early to mid 2020s roughly*.
Prepare for a Repeat of the 1970’s?
If indeed the coming 5 years rhymes with the later half of the 1970’s, we could see stagflation push property prices even higher. But, at the same time, also push precious metals prices higher. This is exactly what happened in the 1970’s. However gold and silver actually rose more in comparison to property.
See the NZ Housing to Gold Ratio for more on this topic: NZ Housing to Gold Ratio
Predictions based on cycles have some merit, given that it is human nature to repeat the same mistakes. But of course there are no guarantees.
Interestingly now seems to have a lot in common with just after the mid 1970’s when stagflaton really started to arrive. Learn more: Could Stagflation Happen Again?
If we see a repeat that would make now a very good time to take a position in gold and silver. It would also make it a good time to diversify to some extent out of property. Particularly here in New Zealand where the price rises have been some of the largest in the world.
Go here to see what precious metals products are available: Buy Gold and Silver Bullion
You might also want to check out: How Does Gold Compare to Shares For the Past 100 Years?
Or: Silver Cycles and War Cycles
Editors Note: This article was first published on 7 November 2017. Updated 3 October 2018 to include latest Auckland and New Zealand house price charts and 2001 to 2018 gold cycle chart. Last updated 18 May 2021 with latest numbers and charts.
Pingback: The Next Great Bull Market in Gold Has Begun - Gold Survival Guide
Pingback: Share Market Plunge - How is New Zealand Affected and What's Next? - Gold Survival Guide
Pingback: The Yield Curve Recession Predictor: Impact on Gold? - Gold Survival Guide
Pingback: The Next Gold Bull Market Looms - Gold Survival Guide
Pingback: What to Do With Your Money When Doom Awaits - Asset Allocation - Gold Survival Guide
Pingback: Where Are We in the Psychology of the Silver Market Cycle? - Gold Survival Guide
Pingback: Massive 5% Rise in NZ Gold This Week - Gold Survival Guide
Pingback: Central Bank: "If The Entire System Collapses, Gold Will Be Needed To Start Over" - Gold Survival Guide
Pingback: Why Buy Gold? Here's 15 Reasons to Buy Gold Now
Pingback: Will This Coming Decade Resemble the 1970’s? - Gold Survival Guide
Pingback: The Fourth Turning and Gold: What’s Still to Come in This Crisis? - Gold Survival Guide
Pingback: NZ Housing to Gold Ratio 1962 - 2019: Measuring House Prices in Gold
Pingback: Record Gold Imports into New Zealand as Investors Seek Haven - Gold Survival Guide
Pingback: When Did New Zealand Switch to Fiat Currency? How Has the New Zealand Monetary System Changed Over the Past Century? - Gold Survival Guide
Pingback: Reader Question: Will New Zealand Property Prices Ever Fall? - Gold Survival Guide
Pingback: What Price Could Silver Reach? - Gold Survival Guide