Gold has once again broken all-time highs in many currencies, including the NZD and USD, sparking renewed interest from investors. But is it truly at a peak—or is there still room to rise? By analysing historical trends, monetary policies, and valuation models, we can estimate where gold prices might be headed next.
In this article, we explore several methodologies to assess gold’s fair value and predict where its price might be headed.
Table of Contents
Estimated reading time: 8 minutes
Does Gold Have a True Valuation? Buffett vs. Reality
Warren Buffett has long argued that gold cannot be valued because it produces no earnings. Critics say gold’s price is based on speculation rather than fundamental value.
However, this argument overlooks a key fact: gold is a measure of fiat currency devaluation.
Gold is not the thing being valued—fiat money is. Instead of pricing gold in fluctuating fiat currencies, we can measure its worth using alternative metrics, such as:
- The percentage gold backing of the US dollar
- The housing-to-gold ratio
- The gold-to-money supply ratio
Gold as a Barometer of Money Printing
- Unlike stocks or bonds, gold doesn’t generate income—but it doesn’t need to.
- Instead, it reflects the amount of currency being created by central banks.
- The more fiat currency is printed, the higher gold’s value tends to rise.
This is why measuring gold against fiat currency reserves can provide a more accurate assessment of its true worth.
Read more on Warren Buffet and Gold: Why Buffett is (Still) Wrong About Gold – But How He Loves Silver
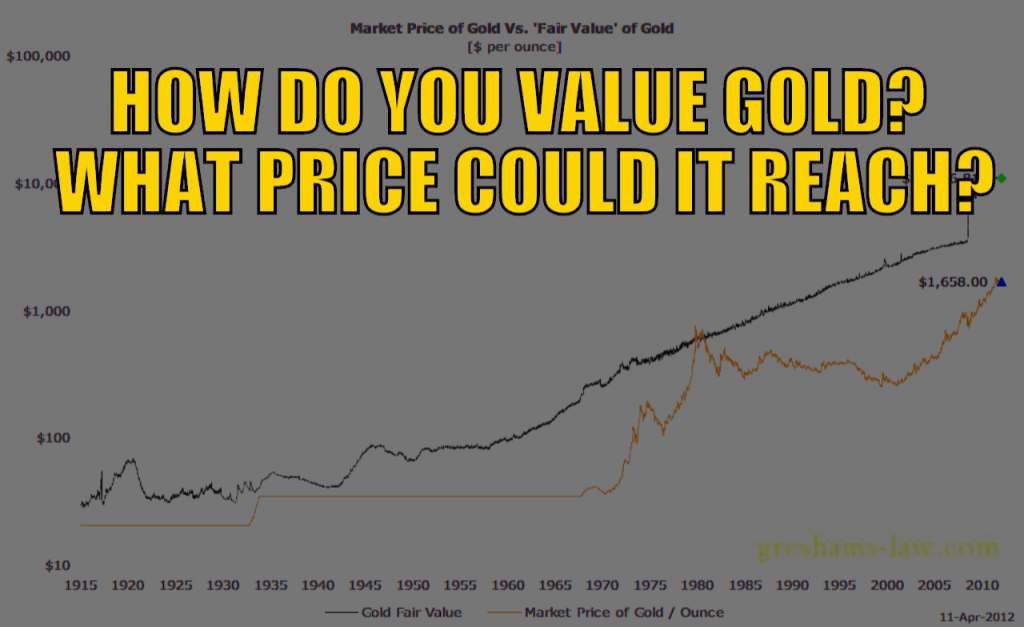
How Do You Value Gold? Methods for Estimating Its Future Price
One effective method is to analyse the percentage gold backing of the US dollar—a measure of how much US dollars are supported by gold reserves.
Gold Backing Formula
📌 Gold Backing % = (Value of US Gold Reserves) ÷ (Federal Reserve’s Balance Sheet)
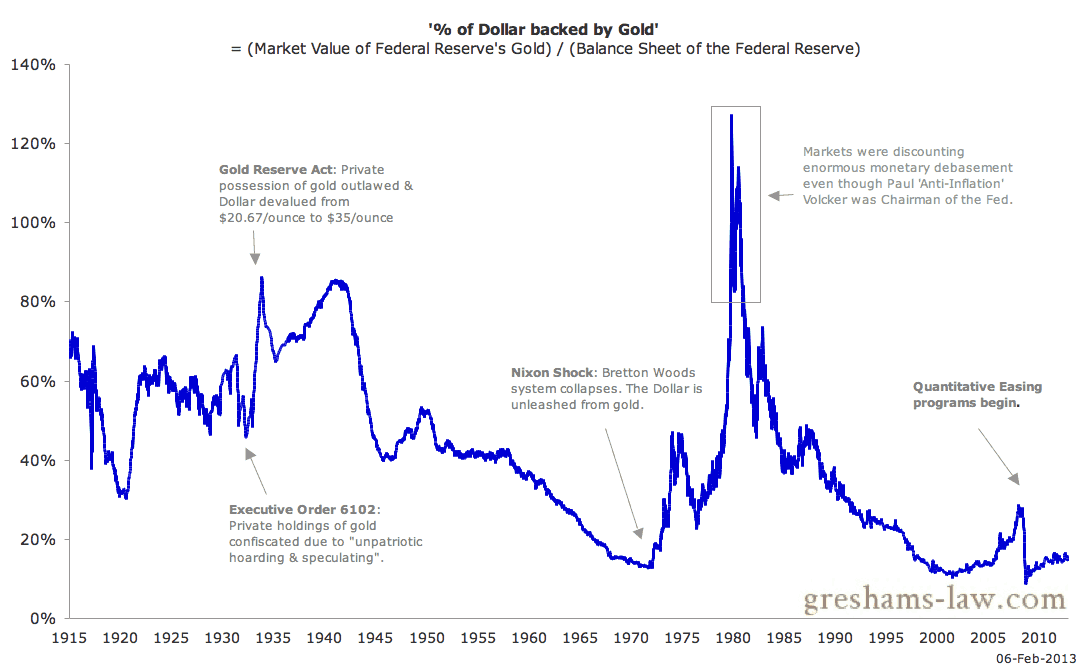
The chart below, from the no longer existent website Greshams Law, shows how this gold backing percentage changed from 1915 to 2013.
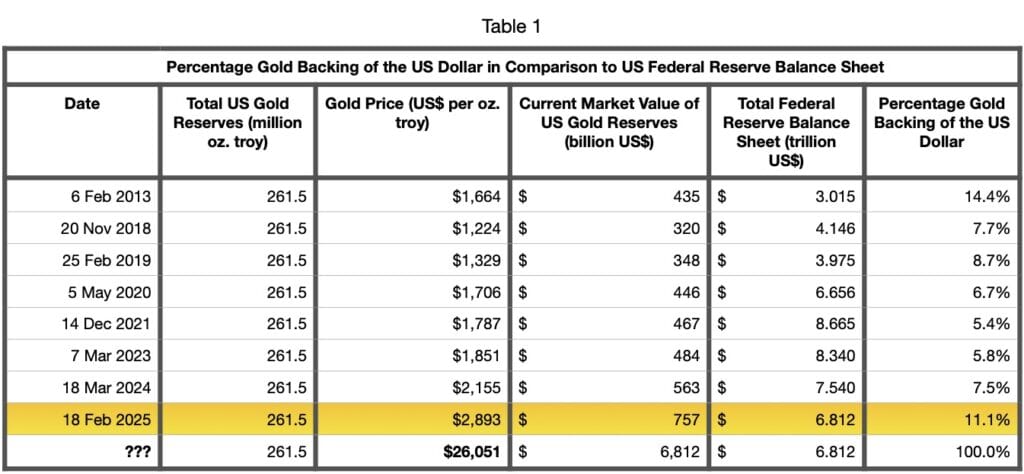
Then, the table below shows the numbers since 2013.
Table 1: Percentage Gold Backing of the US Dollar in Comparison to US Federal Reserve Balance Sheet
Historical Examples
As of 2025, the USD is only 11.1% backed by gold, compared to 130% in 1980 when gold was considered overvalued. Historically, every time this percentage is low, gold has been significantly undervalued—suggesting the current price still has substantial upside.
👉 In simpler terms: The lower the gold backing, the more room there is for gold to rise.
We can therefore use this level of gold backing of the dollar as an indicator for when to sell or swap our gold for something else. That is, when the dollar is close to 100% gold backed (as it was in 1980).
How High Could Gold Go? 2025 Gold Price Predictions
Using the above current data, we estimate gold’s fair value under different scenarios:
| Gold Backing Level | Required Gold Price (USD/oz) |
|---|---|
| 100% Gold Backing | $26,051 |
| 40% Gold Backing (historical standard) | $10,420 |
| Current Price (Feb 2025) | $2,893 |
📌 Key takeaway:
- If gold were 100% backed by the USD, its price would need to rise over 9x from today’s level.
- Even using a conservative 40% backing, gold should be well above $10,400 per ounce—more than 3.5x the current price.
- History shows gold reaches its peak when the USD backing approaches 100%—suggesting today’s gold price still has plenty of room to grow.
Why These Numbers Matter
- In 2013, gold’s fair value was “just” $11,515.
- Due to massive post-COVID money printing, this valuation has jumped to $26,051 in 2025.
- Even using a conservative 40% backing, gold’s fair value is still above $10,400 per ounce.
🚨 Gold is nowhere near bubble territory. Based on historical trends, it still has substantial upside.
Alternative Methods for Valuing Gold
The $26,051 figure using the Federal Reserve Balance sheet is just one method of determining how high the gold price could go.
Gold’s potential price can be estimated using multiple valuation models:
| Valuation Method | Estimated Gold Price (USD/oz) | Key Insight |
|---|---|---|
| Federal Reserve Balance Sheet Analysis | $26,051 | Gold price if USD were fully backed by gold today |
| Gold Backing to Debt Ratio (Historical Reset Model) | $35,800 | Compares gold to US government debt levels |
| Jim Rickards’ 40% Gold Backing Estimate | $10,000 – $11,500 | Based on historical gold backing of the USD |
| Mike Maloney’s Gold-to-Money Supply Model | $14,000 – $18,000+ | Adjusts for all USD base and credit currency |
| Inflation-Adjusted 1980 Gold High (Official CPI) | $3,421 | Adjusted to 2025 dollars using official inflation metrics |
| ShadowStats CPI Inflation-Adjusted High | $28,641 | Uses 1980-era inflation methodology for real comparison |
📌 Key takeaway:
- Even conservative estimates suggest gold could surpass $10,400 – $11,500 per ounce.
- Using historical debt ratios and alternative inflation measures, gold’s fair value is closer to $26,000 – $35,800 per ounce.
- No matter which metric you use, gold remains significantly undervalued today.
Gold Price to Money Supply
Both Jim Rickards global money supply calculation and Mike Maloney’s US base currency (and base currency plus credit card debt) calculation were done in 2018. So currency supply has expanded significantly since then.
Therefore here are the latest money supply calculation numbers for 7 different countries:
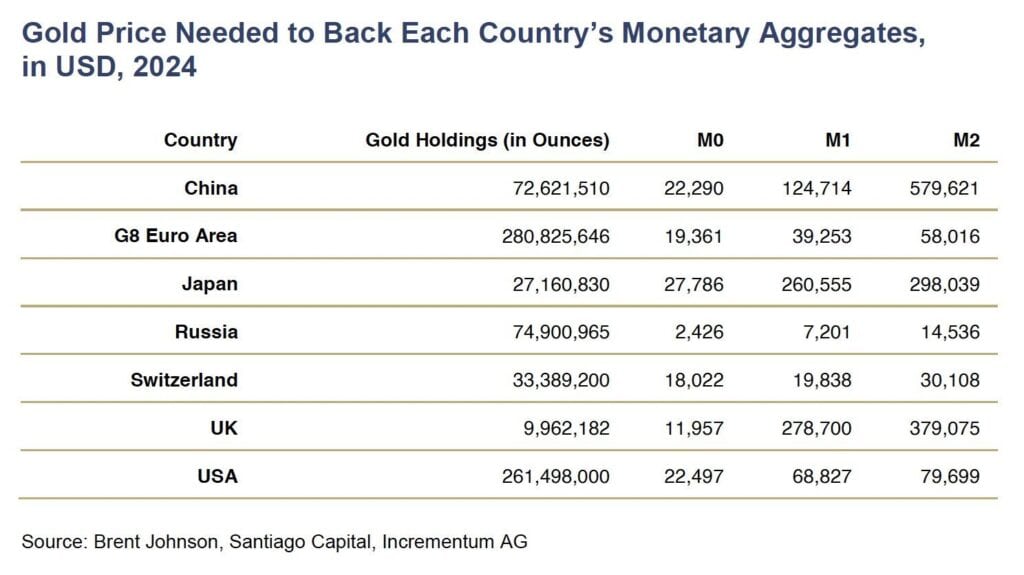
📌 Key takeaway: The USA base currency (M0) gold price number of $22,497 is quite similar to our US Federal Reserve Balance Sheet Analysis: $26,051.
👉 Conclusion: No matter which method you use, gold remains significantly undervalued compared to fiat money supply expansion.
Inflation Adjusted Gold Price
Gold has hit new nominal all-time highs, but when adjusted for inflation, its previous peaks tell a different story.
1. Official Inflation-Adjusted Price
Using the current US government’s Consumer Price Index (CPI) formula, gold’s 1980 high of $850/oz is worth $3,421 in 2025 dollars.

📉 Key Takeaway:
- This suggests that in real terms, today’s gold price is not even close to its true peak.
2. ShadowStats Inflation-Adjusted Price
However, the government’s inflation formula has changed significantly over the past 40 years.
- If we use Shadow Government Statistics (ShadowStats), which applies the 1980-era CPI formula, then gold’s real 1980 peak is $28,641 per ounce.
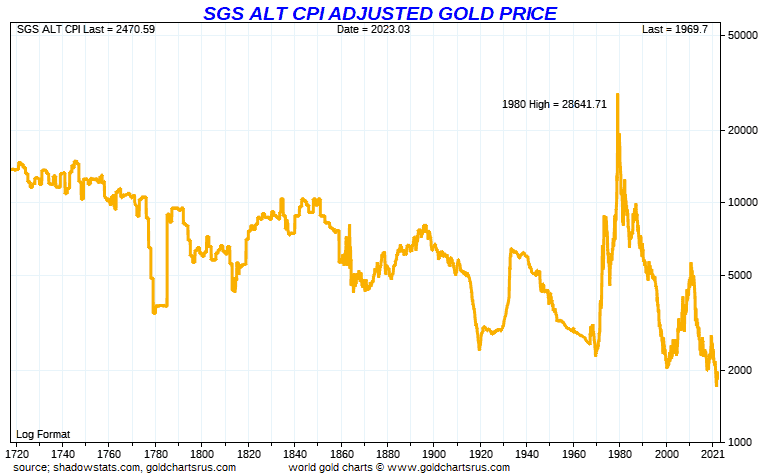
📈 Key Takeaway:
- Using older inflation measures, gold’s fair value is much closer to $28,000—closely matching the Federal Reserve balance sheet method.
Why This Matters
Gold’s inflation-adjusted price provides another way to assess whether it’s overvalued or undervalued:
✔️ Official CPI ($3,421/oz) suggests that gold is only moderately undervalued.
✔️ ShadowStats CPI ($28,641/oz) suggests that gold is still deeply undervalued.
🚨 Bottom line:
Even by official inflation measures, gold hasn’t yet hit its true all-time high—suggesting room for significant future gains.
How High Could the Gold Price Go in New Zealand Dollars?
Now it’s also worth noting that all of the above calculations are in US Dollar per ounce of gold.
For investors in New Zealand, it’s crucial to assess gold’s potential price in NZD terms.
At the current exchange rate of 0.57 NZD/USD, the projected NZD gold price would be:
| Gold Price (USD/oz) | Equivalent NZD Price |
|---|---|
| $26,051 (100% backing) | $45,704 NZD/oz |
| $11,500 (40% backing) | $20,175 NZD/oz |
📌 Key takeaway:
- Even at 40% USD backing, NZD gold could reach $20,175 per ounce—a 4x increase from today.
- If gold were fully backed, it would need to reach $45,704 NZD/oz—matching its 1980 precedent.
- This is not speculation—it’s based on historical monetary resets that have happened before.
Final Thoughts: Is Gold Still a Good Investment?
✅ Current gold backing of the USD is just 11.1%, indicating major upside.
✅ Even using conservative models, gold could surpass US$11,500+ per ounce.
✅ Gold remains one of the best hedges against currency devaluation and financial instability.
💡 Final Thought:
- Gold isn’t just a hedge—it’s a warning signal.
- The world’s central banks continue to devalue their currencies, yet gold’s price remains far below its true value.
- Investors who wait too long could find themselves buying at far higher prices—or missing out altogether.
📢 Next Steps
👉 Secure your gold now: Check out our range of gold bullion here.
👉 Stay ahead of market shifts: Sign up for our daily gold price alerts.
Read more on valuing gold: How Does Gold Compare to Shares For the Past 100 Years?
Editors Note: This post was originally published 24 April 2012. Updated 20 November 2018 to include latest charts and numbers. Updated again 4 March 2019 to include Mike Maloney charts and methodology and latest numbers. Last updated 18 Feb 2025.

Glenn's dedication to educating individuals on wealth protection through precious metals has helped over 2400 clients from New Zealand, Australia, USA and Europe to safeguard their financial futures. Passionate about financial independence and lifestyle freedom, Glenn’s mission is to empower others with the knowledge and tools to thrive in today’s volatile economic environment. When he's not advising on precious metals, Glenn enjoys spending time with his family and pursuing outdoor adventures.
Education: University of Auckland Bachelor of Science
Linkedin: https://www.linkedin.com/in/glenn-thomas-0984a4310/
- The Best Time to Buy Gold Is Before You Need It - May 14, 2026
- Silver Breaking Higher as Inflation Heats Up Again - May 13, 2026
- Does Gold Seasonality Affect the NZ Dollar Gold Price? - May 12, 2026
Pingback: Gold in NZD - how much longer at this level? | Gold Prices | Gold Investing Guide
Pingback: Is it Time to Sell Gold or Silver? | Gold Prices | Gold Investing Guide
Pingback: Exit Strategies For When the Time Comes to Sell Gold and Silver
Pingback: Gold and Silver Technical Analysis: The Ultimate Beginners Guide - Gold Survival Guide
Pingback: Why Gold Bullion is Your Financial Insurance - Gold Survival Guide
Pingback: Is it too late to buy Gold?
Pingback: What Percentage of Gold and Silver Should Be in My Portfolio? - Gold Survival Guide
Pingback: Gold vs Bitcoin/Cryptocurrencies - Which One Should You Choose? - Gold Survival Guide
Pingback: Gold Cycles vs Property Cycles: When Will Gold Reach Peak Valuation? - Gold Survival Guide
Pingback: The “Time Price” - Why Gold is Money and Will Continue to Be - Gold Survival Guide
Pingback: NZ Housing to Gold Ratio 1962 - 2019: Measuring House Prices in Gold
Pingback: Why Buy Gold? Here's 15 Reasons to Buy Gold Now
Pingback: Gold Backing to Debt Ratio: A Reset Like in 1934 and 1980 Would Mean $25,000 Gold - Gold Survival Guide
Pingback: Is it Too Late to Buy Gold? [Video] - Gold Survival Guide
Pingback: Silver Bouncing Off Trendline - Gold Survival Guide
Pingback: 27 Ounces of Ancient Gold to Buy “a Fancy House in One of the Best Neighborhoods” - Gold Survival Guide
Pingback: New Zealand Bank Deposit Protection Scheme - Does N. Z. Have Bank Deposit Insurance? - Gold Survival Guide
Pingback: Gold Price Forecast: What Experts Predict - Gold Survival Guide
Pingback: Real Gold vs Fake Gold: How To Tell if Gold is Real - Gold Survival Guide
Pingback: What Will the Long Term Impacts of SVB and Signature Bank Bailouts Be? - Gold Survival Guide
Pingback: A Worldwide “Glut” of Unsold Properties? - Gold Survival Guide
Pingback: How to Safely Hold Dollars, Remain Liquid, and Seize Short-term Opportunities - Gold Survival Guide