Prices and Charts
Weaker Kiwi Boosts NZD Gold
Gold in NZ dollars was up triple digits this week. Rising by $162 (4%), due mostly to a weakening Kiwi dollar and breaking above $4000!
In USD terms gold rose just 1%, hovering around $2400. Gold took a sharp dive on Friday night but then the Iran missile attack boosted it back up again (see more on that topic in this week’s feature article below).
In both currencies gold is still super overbought. We are still watching for a pullback. What looked like the start of it over the weekend has also been just a pause.
Our charts show possible major buy zones to watch for. With gold clearly in a bull market again, buying any dip is our thinking. The tricky thing is picking how deep any pullback will be. In the long run it probably won’t make that much difference.

USD Silver Touches $30
The rise in NZD silver this week was solely due to the weaker Kiwi dollar. Up $1.35 (2.9%) to $47.83. Like gold, silver is also very overbought. Though unlike gold it has not been this way for very long.
In USD terms, silver got up to the key $30 level over the weekend, before pulling back. It seems like only a matter of time before that level is broken too though. Then there is a lot of upside above $30.

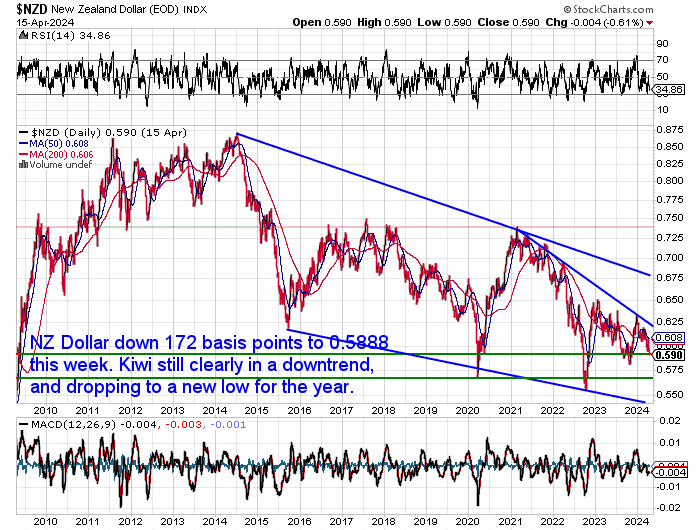
NZ Dollar Hits New Low for 2024
The NZ dollar continues to weaken, hitting a new low for the year today. Down 172 basis points (almost 3%) from last week to 0.5888. As noted this boosted local precious metals prices higher.

Need Help Understanding the Charts?
Check out this post if any of the terms we use when discussing the gold, silver and NZ Dollar charts are unknown to you:
Continues below
—– OFFER FROM OUR SISTER COMPANY: Emergency Food NZ —–
Long Life Emergency Food – Back in Stock

These easy to carry and store buckets mean you won’t have to worry about the shelves being bare…
Free Shipping NZ Wide*
Get Peace of Mind For Your Family NOW….
—–
Gold: Safe Haven During Times of Trouble?
With Iran launching missiles at Israel over the weekend, and tensions rising on the world stage, many investors will turn to gold as a potential hedge. But does war truly lead to a sustained increase in gold prices? Our latest article dives into the complex relationship between global conflict and the precious metals market. We explore historical examples, analyse the short-term vs. long-term effects, and uncover the key factors that truly influence gold’s price during periods of war. Is gold the ultimate safe haven, or is there more to the story? Head over to this week’s feature article to find out!

Your Questions Wanted
Remember, if you’ve got a specific question, be sure to send it in to be in the running for a 1oz silver coin.
Our Thoughts on Mainstream Media Thoughts on Gold
The rising gold price now has even mainstream analysts updating their price forecasts. This week, a report said Bank Of America Sees Gold At $3,000 by 2025.
Gold then made the network news here in NZ on Friday night. Perhaps not surprisingly gold then took a sharp dive over the weekend! Mainstream media is a very good contrarian indicator!
So while mainstream media presence might be a good indicator of potential for a short term pullback, the overall tone of the report and the article now posted on the 1 News site looks to us to be an indicator of why the price will go much higher yet.
First the title: Gold rush as price hits all-time high — is it time to cash in?
Friday wasn’t the day it first hit an all time high. Gold has actually been hitting all time highs for the past few weeks. So it’s taken a sharp jump to even make the news.
The title, “Time to cash in”, also implies it’s time to sell, not time to buy.
This is the general theme of the piece as well:
“The price means Kiwis are cashing in their own golden treasure in the hopes of a hefty profit.”
And while there is talk of further upside, “experts are predicting it may still shine even brighter”, it finishes with this line:
“It’s certainly on a steep curve up but it could just as easily go the other way”.
So while we’re overdue a correction, to us this news item means gold has much higher and longer to run yet.
China Controls the Gold Price – Same for Silver Soon Too?
We’ve been reporting on China and it’s gold buying for a while now. Both by the central bank and also by its citizens too.
Here’s another one from the South China Morning Post
China’s gold markets under strain as horde of new buyers hunts for stable investment
- China’s gold market, considered one of the country’s few safe investments, has been booming as buyers look to cash in on price jumps
- Precious metal has seen regular peaks in value in recent months, with retail sites slammed with requests from eager would-be speculators.
Source.
But this article now reports that the “Chinese government is advertising and telling its loyal people to buy Silver instead of Gold”.
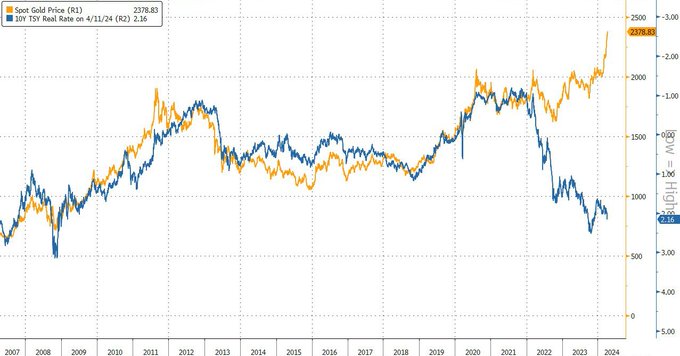
There’s been a good argument made by Jan Nieuwenhuijs as to why China has been controlling the gold price since 2022. Here’s a comment by another writer as to why after initial scepticism she believes this theory has legs: Gwen Preston – “Is China Controlling The Gold Price?”
Therefore explaining why gold diverged from real (after inflation) interest rates back then.
this is a 17 year chart, let that sink in. holy sh*t
this is not normal

Source.
So with this report of the Chinese government now encouraging silver purchases as well, could China start to begin to have more impact on the silver price as well?
Second Wave Inflation Indicators in the USA – What About NZ?
The US has a lot of inflation data and measures and they come out monthly.
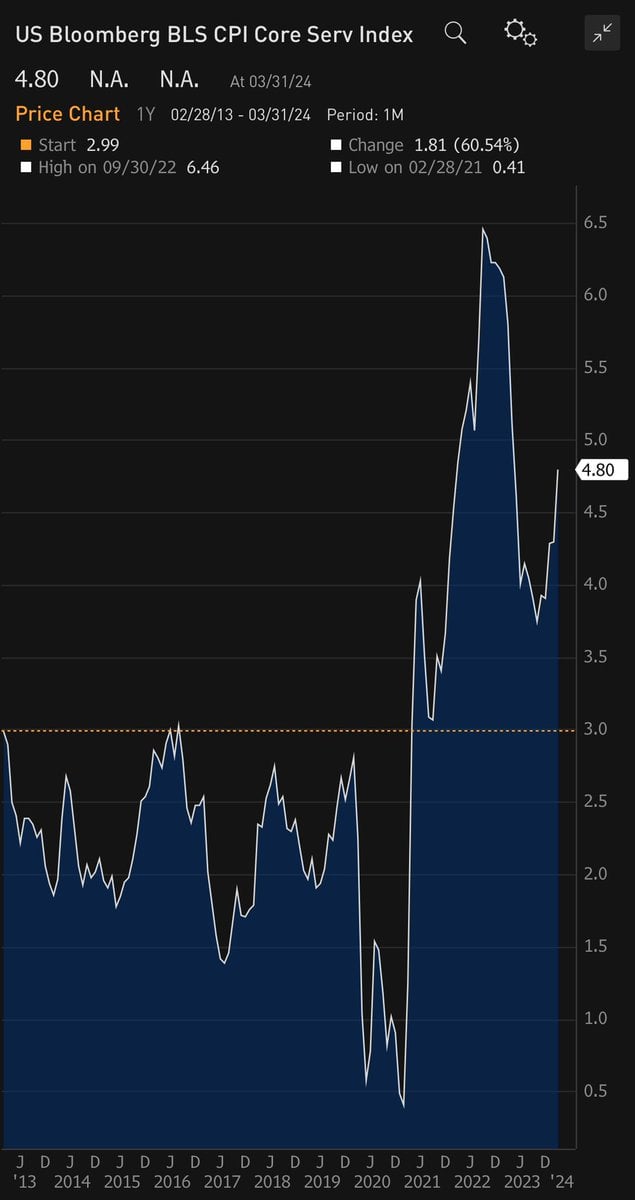
Paulo Macro has discussed multiple inflation waves for some time. Below he shows that one measure the “Core Services Index” has been ticking higher since late last year:
CPI Core ex housing (supercore) YoY.
Do you guys see the Second Inflation Wave now?
This was challenged (👍) and even mocked (👎) by many only a few months ago, including by some who now embrace it as their own.

Source.
Next up, an interesting chart comparing the US CPI (consumer price index) with PPI (Producer Price Index).
One of the coolest charts I’ve seen. Pro-level work, Kevin!
US CPI data is out today. Gold likes it when CPI underperforms PPI #Silver #Gold #preciousmetals #Commodities #Inflation
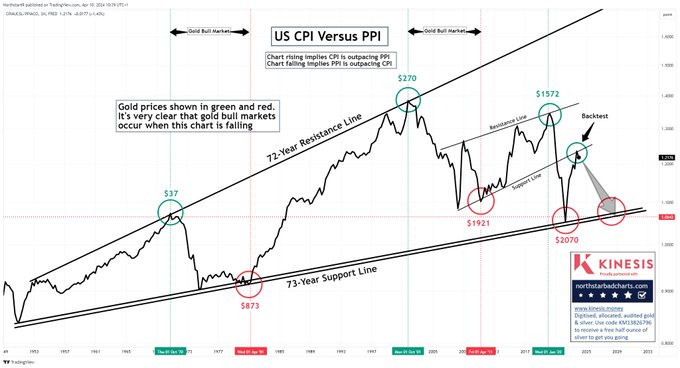
Source.
But what does this mean?
A falling chart shows that the PPI (business prices effectively) is outpacing CPI (consumer prices).
Again, so what?
Well, the PPI tracks prices at the wholesale level, so it reflects what businesses pay for goods and services from producers. The Consumer Price Index (CPI) tracks prices at the retail level, so it reflects what consumers pay for goods and services.
When PPI outpaces CPI, it means that the prices businesses are paying for goods and services are rising faster than the prices consumers are paying. This can be a sign of inflation working its way through the system.
The gold prices in Red and green show gold bull markets also take place in this environment.
Why?
Our guess would be that gold “sniffs” out the likelihood of future inflation and prices this in before it happens.
What About in NZ? Are There Second Wave Inflation Indications Here?
Our main CPI data is quarterly although Stats NZ is now publishing a reduced CPI measure monthly.
The Business Price Index which also includes Producers’ Price Index is also only issued quarterly.
The below chart of quarterly percentage change shows this index bottoming in early 2023 and rising a little since then.
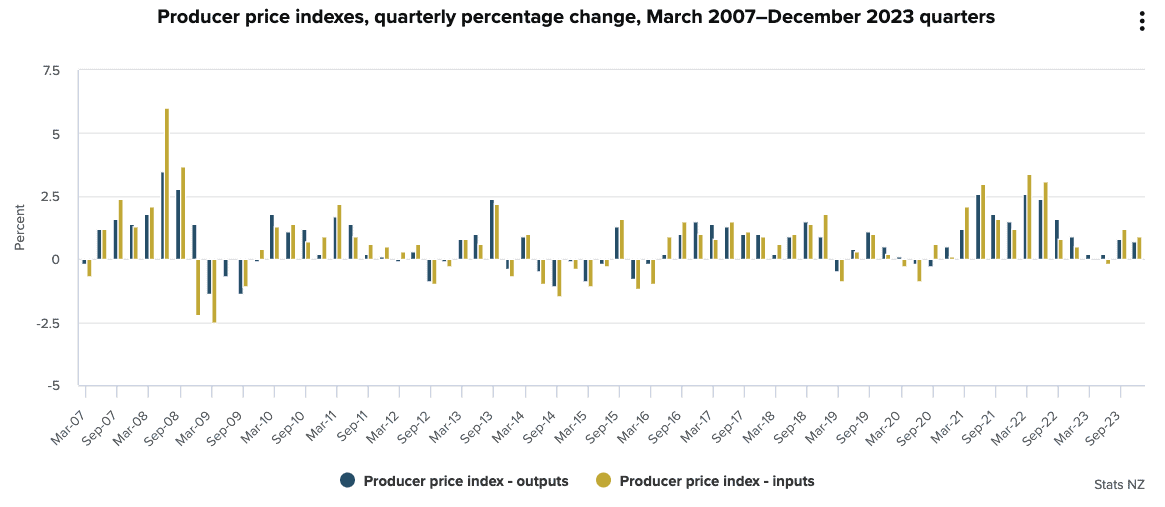
However, given that NZ imports so much more than it exports, we import a lot of inflation too. Currently this “imported inflation” has been falling and is what has pushed the NZ CPI lower. But higher producer prices in the likes of the US and elsewhere will likely show up eventually in consumer pieces here too.
One recent report was that a business survey indicated inflation was dipping but not fast enough:
“A survey of 10,000 business leaders suggests economic confidence is tumbling and bringing inflation indicators down with it, but not fast enough for some economists.”
Source.
Also Bank Economists expect inflation to come in today higher than the RBNZ forecast.
With Westpac and Kiwibank casting 4.2% as their expected annual inflation rate, and with ANZ coming in lower at 4%. While the RBNZ expects annual inflation to decrease to 3.8%, still ahead of its 1% to 3% target.
Source.
Regardless of what the actual numbers are printed at this afternoon, we’re still betting that in the not too distant future New Zealand will also experience a second wave of inflation.
So the return to “normal” inflation might be about as likely to occur as the “transitory” inflation we were supposed to get back in 2021/22.
Are you prepared for further debasement of the currency you use every day?
Please get in contact for a gold or silver quote, or if you have any questions:
- Email: orders@goldsurvivalguide.co.nz
- Phone: 0800 888 GOLD ( 0800 888 465 ) (or +64 9 2813898)
- or Shop Online with indicative pricing
— Prepared for the unexpected? —
Never worry about safe drinking water for you or your family again…
The Berkey Gravity Water Filter has been tried and tested in the harshest conditions. Time and again proven to be effective in providing safe drinking water all over the globe.
This filter will provide you and your family with over 22,700 litres of safe drinking water. It’s simple, lightweight, easy to use, and very cost effective.
—–
|