The housing to gold ratio shows that when priced in gold, New Zealand median house prices have fallen 49% since 2005. See how history shows New Zealand house prices could fall 79% further yet...
Table of Contents
- How to Calculate the Housing to Gold Ratio
- Comparing the NZ Housing to Gold Ratio to the UK and USA
- Could NZ House Values Drop by 80 Percent?
- Summary – Using the Housing to Gold Ratio
- How About Silver?
Estimated reading time: 10 minutes
There’s always plenty of discussion in the mainstream media about where house prices are going. Given New Zealanders predilection for property it’s no surprise. However the prices used are always the nominal NZ dollar prices.
However, (as discussed previously), when looking at historical returns, it’s important to take into account money (or perhaps more correctly currency) supply inflation, and its impact on the buying power of the dollars you hold.
So that’s why we’ve gone to the trouble of plotting New Zealand house prices against New Zealand gold prices. Thereby hopefully showing house prices in a new light….
How to Calculate the Housing to Gold Ratio
The housing to gold ratio is calculated by dividing the median house price by the monthly gold price in NZ dollars. We then arrive at the number of ounces of gold required to purchase the New Zealand median house.
For example for at the end of December 2023:
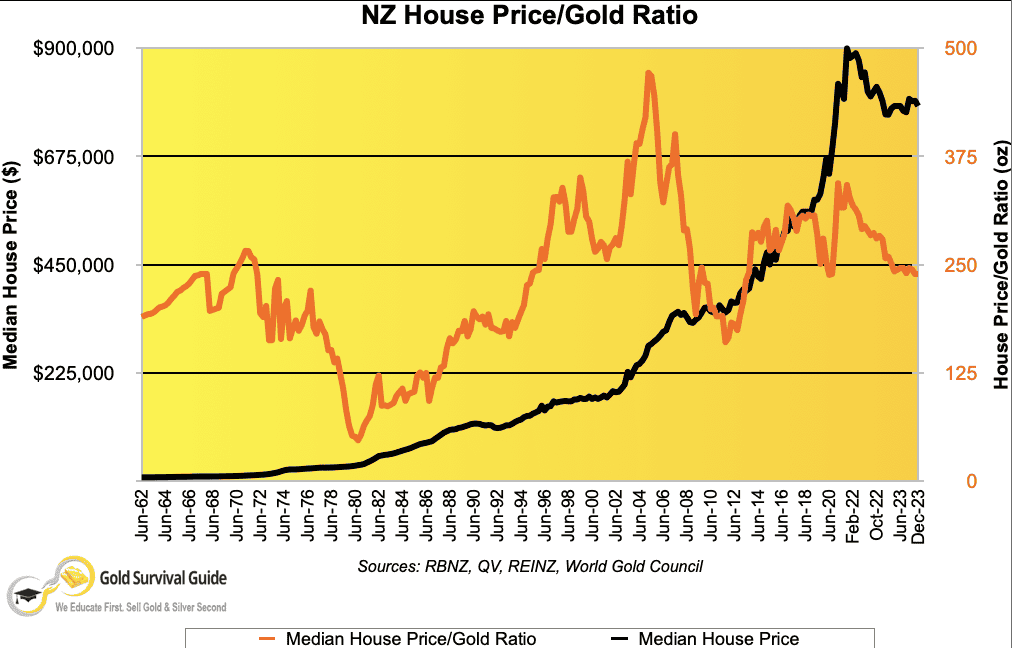
NZ$780,000 divided by NZ$3264.75 /oz equals 239 ounces.
So it took 239 ounces of gold to buy the median priced New Zealand house as of December 2023.
The below graph depicts the commonly publicised New Zealand median house price (black line and left axis). But also the house price to gold price ratio (orange line and right axis) since 1962.
Comparing the NZ Housing to Gold Ratio to the UK and USA
We can compare this New Zealand data to that of the UK and USA average housing to gold ratios. Charts are care of Bullionvault – which date back the furtherest. Also from Nick Laird’s always excellent goldchartsrus.com – which has the most up to date numbers…
UK House Prices in Gold

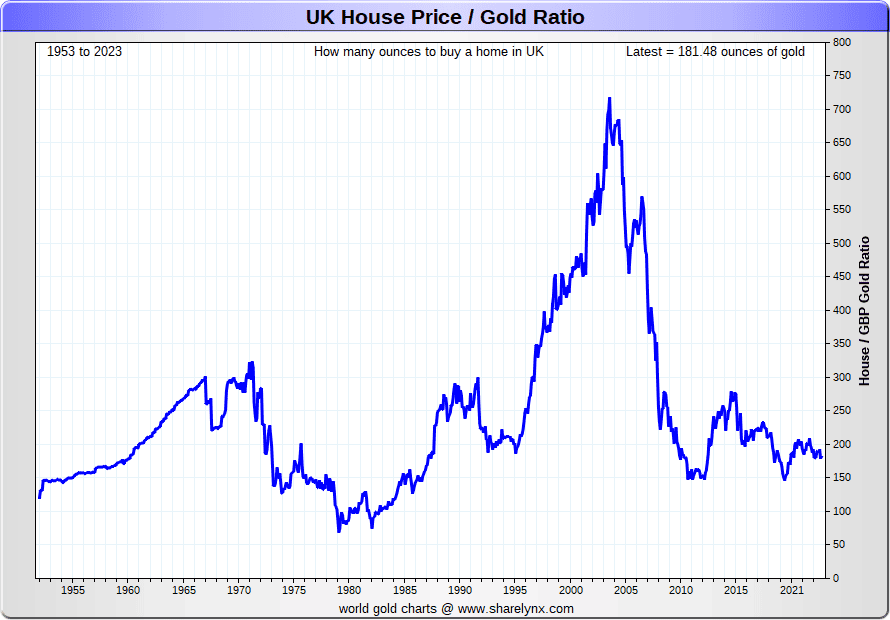
Let’s compare the UK (above long term chart with gold background) and US (below long term chart also gold background). Notice how towards the end of the 2 biggest recessions of the previous century – one, the deflationary depression of the 1930’s and the other, the inflationary 1970’s – the ratios both dipped below 100 oz’s to purchase the average house.
US House Prices in Gold

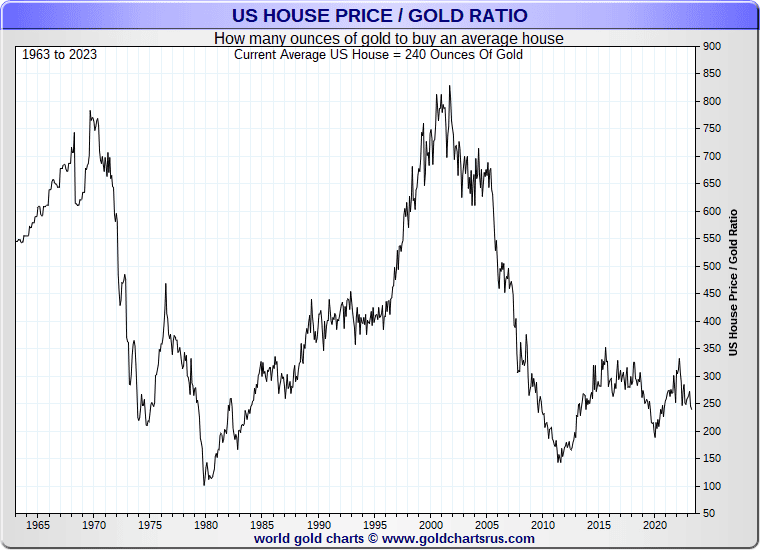
While our New Zealand data doesn’t go back that far, notice how similar the New Zealand graph is to the UK data since 1962. Both peaked around 1970 at close to 300 ounces. Both then fell below 100 in 1980. They then climbed steadily with a bit of a stumble in the 90’s, to peak in the mid 2000’s.
So perhaps it’s reasonable to assume that the trend was similar during the 1930’s depression era here too?
(Note: Be aware when comparing, that the US and UK house price numbers in the above charts are the average, whereas our ratio numbers are based upon the NZ median, or middle house price. So while similar these are not quite the same measure).
Now, let’s refer back to the New Zealand graph (reproduced again below for ease of comparison). Note how at the end of the 70’s the housing/gold ratio drops down to almost 50 oz of gold to buy the median house!
If history repeats, and the trends in the US and UK are similar to New Zealand, could we be heading down close to 50 ounces again by the end of the current cycle?
Related: Gold Cycles vs Property Cycles in 2020: When Will Gold Reach Peak Valuation?
Could NZ House Values Drop by 80 Percent?
Also worth noting is that house prices in NZ dollar terms continued to rise up until the end of 2021. Even COVID-19 didn’t put much of a dent in them. In fact, the government stimulus, record low interest rates and currency printing by the Reserve Bank, actually gave house prices a hefty boost since May 2020. Hitting a new record in December 2021 of $900,000, the chart was looking rather parabolic. However, even though the median house price hit an all time high in 2021, when priced in gold, housing peaked in 2005 at 472 ounces (see the peak of the orange line above).
Then in 2022, with the dramatic increase in interest rates, we saw the median house price fall quite noticeably. Along with gold prices in NZ dollar also rising.
So, at first glance it may seem like you’ve “missed the boat” if you didn’t sell housing and buy gold in 2005, when the top was in at close to 500 oz.
With the ratio then falling from 472 to 160 in 2011, you would have been able to buy back the same house and still have over 300 ounces left. Or put another way you could then have bought 3 houses. That is, thrice the buying power in real estate by holding gold for 6 years.
However if we consider that in the 1970’s the ratio bottomed at 50, this is a further 79% drop in the ratio from today’s value of 239!
Key point: It’s the proportional drop in the value of housing to gold that is the key factor.
So an average house sold today would net you 239 oz of gold. If the past trends both here, and in the US and UK hold true, we may see the ratio drop below 100. Here in New Zealand maybe even bottoming out as low as 50, by the end of this current gold bull market.
That would mean you could buy back the same house for 50 ounces of gold. Still having 189 ounces left over. Or using the same analogy as above you could then buy almost 5 houses! Even if the ratio only dropped to 100 ounces you could still buy the same house back almost twice over.
Bear in mind that this drop against gold could happen without house prices actually falling in nominal NZ dollar terms. Instead merely just through expanded currency supply holding house prices up – i.e. the kiwi dollar being devalued.
Comparing Some Numbers: If the Ratio Falls What Price Could Gold Reach?
Nominal House Prices Stay the Same – Gold Rises
For example, for the ratio to bottom out at 50, the median house price could remain at the current price of NZ$780,000. And gold could rise to NZ$15,600 (i.e. NZ$780,000 / 50 = NZ$15,600). Notice how in the 70’s housing actually went up for the whole decade in dollar terms (black line in the chart). While falling for the decade in gold terms (orange line).
Nominal House Prices Plunge – Gold Holds Steady
Or you could have gold holding steady and nominal house prices dropping markedly. With NZD gold averaging NZ$3265 in December 2023, the current median house price would have to drop to $326,500 just to return to 100 ounces! Ouch!
Nominal House Prices Fall – Gold Rises
But perhaps a more likely scenario is to have a combination of the nominal dollar price of housing falling and gold rising? For example, gold at $5000NZ and the NZ median house price dropping to $500,000 would result in a 100 oz ratio.
Nominal House Prices Rise – So Does Gold
Or how about this possibility? For housing to rise in nominal dollars. But gold to rise at an even faster rate. This is just what occurred in the 1970’s. Let’s say the median house price rises over the next number of years to $1,000,000. If we see the housing to gold ratio return to the 1980 low of 50ozs, that would result in a gold price of NZ$20,000.
This might sound like a crazy number. But it’s in line with those reached by valuing gold using other methods. See: How Do You Value Gold | What Price Could Gold Reach?
If history at least rhymes a little bit, whichever of the above scenarios play out, holding gold should result in improved buying power when it comes to real estate in the coming years.
Using the last example above, nominal house prices would have increased by around 28% (current median $780,000 rising to $1,000,000). But gold would have risen by 513% (December 2023 price NZ$3,265 rising to $20,000).
Paper Currency Varies – Gold Does Not
This concept of pricing things in gold can take a bit of getting your head around. The point to consider is that while the gold price appears somewhat volatile, it is actually the paper or fiat currency that is varying. Gold is steadily buying more and more. While paper currencies are steadily buying less and less.
Just look at petrol and food prices for example. Thinking of everyday goods in terms of how many ounces (or fractions of an ounce) of gold it takes to buy them, can be a revelatory way of thinking.
Summary – Using the Housing to Gold Ratio
So to summarise:
- When priced in gold, the New Zealand median house peaked in 2005 at 472 ounces.
- Since then it has fallen by as much as 300 ounces to 160 ounces. Before rising back as high as 342 ounces in December 2021.
- UK and US data shows the ratio dipped below 100 ounces after the 1930’s depression and the inflationary 1970’s.
- Past New Zealand data shows the ratio reached a low at the end of the inflationary 1970’s of just over 50 ounces. This is a further 79% drop from December 2023’s ratio of 239 ounces.
- It might be hard to time exactly, but when houses priced in gold are below 100 ounces it could be a good time to think about exchanging some gold for property. Around this time some of the other factors in our article “When will you know it’s time to sell gold”, could also be appearing.
- Hint: To do step 5 you need to own some gold!
Note: We’ll be updating this data a couple of times a year and publishing the changes. So if you want to stay informed about when NZ housing will again be good value, then sign up for our email updates in the box below.
How About Silver?
Interested in the numbers for silver versus housing? Then check out: NZ Housing to Silver Ratio 1968 – 2023: Measuring House Prices in Silver
Notes on calculations for the New Zealand median house price:
As it’s difficult to get long range median house prices, the NZ median price was calculated using a variety of measures as over time these have changed. The RBNZ house price index data was used to extrapolate from more recent median house price data.
From June 1962 to December 1980 the data is taken from the RBNZ: House Price Index for ‘detached houses’ only.
January 1981 to December 1991 data was taken from the RBNZ House Price Index – All Residential Dwellings.
Then from January 1992 to current date, data is taken from the REINZ Median House Price.
From January 2022 monthly data has been added instead of just quarterly.
Editors Note: Housing to Gold ratio data was first published 23 February 2010. Updated 12 March 2011. These articles then combined and update 6 November 2019. Last updated 5 Feb 2024 with December 2023 data.
Pingback: Could NZ house values drop by 80%? | Gold Investing Guide
Pingback: NZ Housing to Silver Ratio | Gold Investing Guide
Pingback: Just checking: Is gold in a bubble? | Gold Investing Guide
Pingback: Will NZ Banks Buy Gold? | Gold Prices | Gold Investing Guide
Pingback: Housing Un-affordability: It’s Not Supply, It’s the Debt Stupid! | Gold Prices | Gold Investing Guide
Pingback: Gold Prices | Gold Investing Guide What Good is a Bar of Gold When the Shelves are Empty?
Pingback: Gold Prices | Gold Investing Guide Gold and Silver Vs Stocks and Real Estate - Where Are We in the Cycle?
Pingback: Gold and Silver Chart-fest -
Can we have an update for 2016 please?
Median house price has gone up to NZ$460k (11/2015) while gold is trading at NZ$1860/oz (07/2016) making a ratio of 247 ounces of gold to buy a median house.
So, if in 2010 you’d exchanged your median house for 195 ounces of gold and then wished to buy back your house today, you’d have to cough up 247-195=52 ounces of gold extra..
In other words, housing outperformed gold by 52x$1860=$97k – oops.
Still, housing is in a bubble and gold is not so I’d hang on to the gold for the long term. NZ house prices will implode as soon as the banks are no longer
able to get cheap credit.
Pingback: Warning Signs Are Appearing in Many Countries - Gold Survival Guide
Pingback: NZ Housing to Silver Ratio 1968 - 2019: Measuring House Prices in Silver
Pingback: Gold Dipping Lower - Gold Survival Guide
Pingback: Why Buy Gold? No Fiat Currency Lasts Forever - What About the NZ Dollar? - Gold Survival Guide
Pingback: Silver Bouncing Off $26 Again - Gold Survival Guide
Pingback: Where Will the NZ Govt Get the Money for its Dramatic Increase in Spending? Tax, Borrow or Just Print it? - Gold Survival Guide
Pingback: When Will You Know It's Time to Sell Gold?
Pingback: 27 Ounces of Ancient Gold to Buy “a Fancy House in One of the Best Neighborhoods” - Gold Survival Guide
Pingback: The Most Common Question When Buying Precious Metals - Gold Survival Guide
Pingback: Gold - a Leading Indicator for Bond Yields Topping Out? - Gold Survival Guide
Pingback: Bank of America: USA May Experience Hyper-inflation Soon - But Will Be “Transitory” - Gold Survival Guide
Pingback: Record Gold Imports into New Zealand as Investors Seek Haven - Gold Survival Guide
Pingback: Will New Zealand Property Prices Ever Fall? - Gold Survival Guide
Pingback: What Percentage of Gold and Silver Should Be in My Portfolio? [2021 Update] - Gold Survival Guide
Pingback: Even the Mainstream is Now Finally Wondering "is Inflation Here to Stay"? - Gold Survival Guide
Pingback: Why Buy Gold? Here's 15 Reasons to Buy Gold Now
Pingback: Is Now a Good Time Buy Gold in New Zealand? - Gold Survival Guide
As far as I can see this article does not take into account that gold is subject to capital gains tax and most property is not. So the comparisons are not valid.
HI Maurice, We’ve kept it simple and haven’t included any other costs like possible taxes on either, but also storage costs for gold. However we also haven’t included rates, insurance and maintenance costs for property either. It was not meant to be a rationale as to why you might buy one over the other. Many people own property and gold. But we still think it is valid to compare the overall valuations of the different assets. As it shows how one might be undervalued currently compared to the other.
Pingback: Economic update June 2023 | NZ News Essentials
Pingback: Gold Ratios April 2020: Dow/Gold, NZ Housing to Gold, & Gold/Silver Ratio - (Plus All New Beer to Gold Ratio!) - Gold Survival Guide
Pingback: Economic update June 2023 – CENTRIST
Pingback: Economic update June 2023 – CENTRIST
Pingback: Record Central Bank Gold Demand Continues - Gold Survival Guide