The price of gold has been bumping around all time highs in New Zealand dollar terms this year. So it’s time for another updated look at a number of gold and silver charts and gold ratios. Here’s what’s covered:
Table of contents
Estimated reading time: 9 minutes
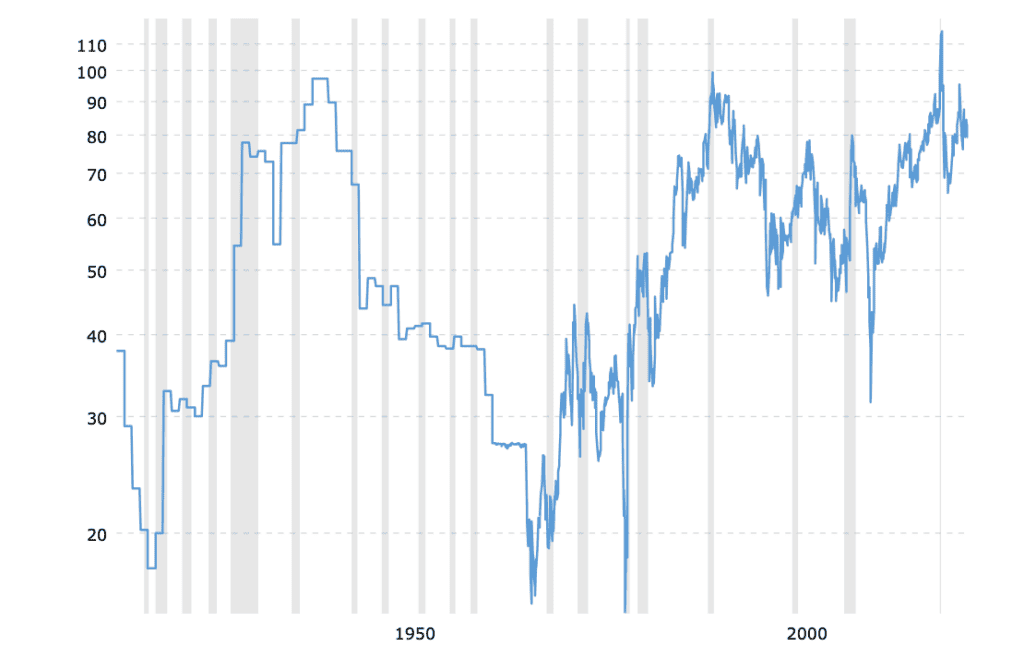
Dow/Gold Ratio
The relationship between gold and shares is best tracked by the Dow/Gold ratio.
The Dow/Gold ratio takes the value of the US Dow Jones Industrial Average and divides it by the price of one ounce of gold in US Dollars. Or put another way – how many ounces of gold it takes to “buy the Dow”. Basically a measure of how cheap (or expensive) shares are versus gold.
Up until the last quarter of 2018, the Dow/Gold ratio had been moving higher. This meant the Dow was gaining value versus gold. Since 2011, the Dow to Gold ratio touched the rising trend line fives times. But each time it turned back up.
The Trend Changed in 2018
However in the last quarter of 2018 the Dow to Gold Ratio turned down and broke below the blue uptrend line in December. The trend since then has been steadily lower. But with the stock market crash brought about by the initial outbreak of COVID-19 in early 2020, the ratio dropped below 12. The US share market bounced after this. However it has been unable to get back above the blue downtrend line. The Dow to Gold ratio is currently just under 18. So a downtrend clearly remains in place.
It appears even more likely we will continue to see stocks falling versus gold. Just as they were from 2000 to 2011. This could take place while the nominal or dollar price of shares goes up. It would be that the gold price just goes up more.
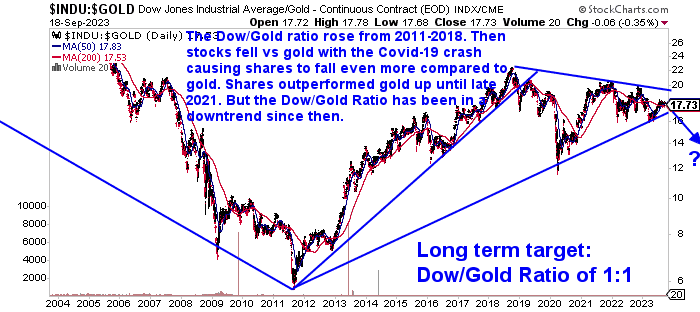
Nonetheless, our long term target for the Dow/Gold ratio remains around 1:1.
One example would be for the Dow to fall to 8000 and for gold rise to US$8000 per ounce.
But remember, this doesn’t necessarily mean the sharemarket has to fall. Merely that shares just don’t rise as much as gold.
See the very long term Dow/Gold Ratio chart below from Sharelynx.com for why 1:1 (or even lower) looks like a good bet. The rise from 2011 to 2018 looks remarkably similar to the mid 70’s rise, before gold resumed its upward march. And the ratio once again fell. Is history repeating or rhyming at least?
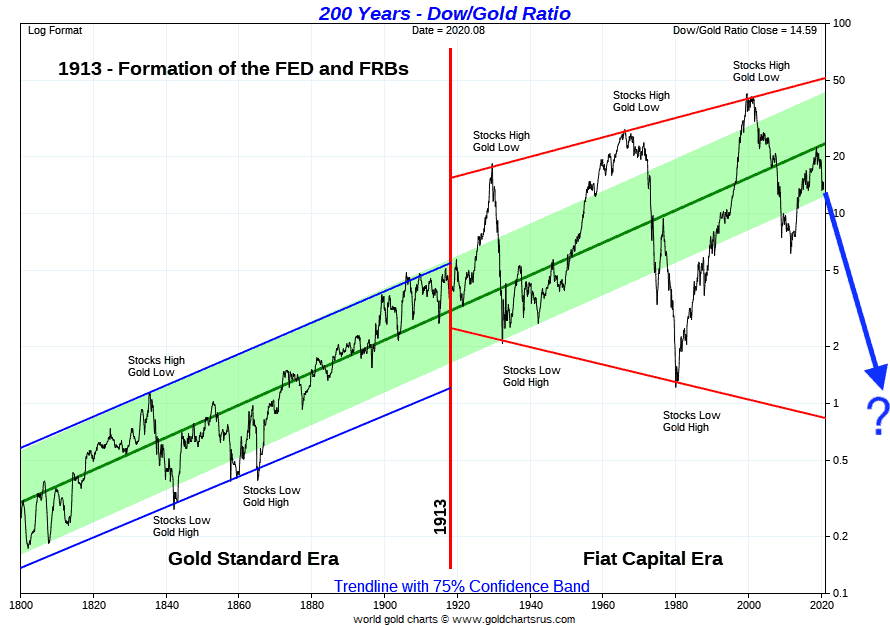
That is, with the ratio hitting the green trend line (like the mid 1970’s), are we now seeing the Dow Gold ratio turn back down and continue lower (indicated by the blue arrow). As this green trend line has acted as a resistance/pivot zone multiple times during this “FIAT only” era since 1913.
Read more on the Dow/Gold Ratio: How Does Gold Compare to Shares For the Past 100 Years?
Gold/Silver Ratio
The Gold/Silver ratio is simply the number of ounces of silver it takes to buy one ounce of gold. To calculate the gold to silver ratio on a given day, take the gold price and divide it by the silver price.
We have covered the gold to silver ratio extensively in another post. So we won’t spend too much time on it here. But you can learn more here.
Suffice to say with the ratio currently still above 80, a place that it has only been as high as a handful of times in the past 50 years, silver still remains very, very cheap compared to gold. Therefore silver is currently the better buy.
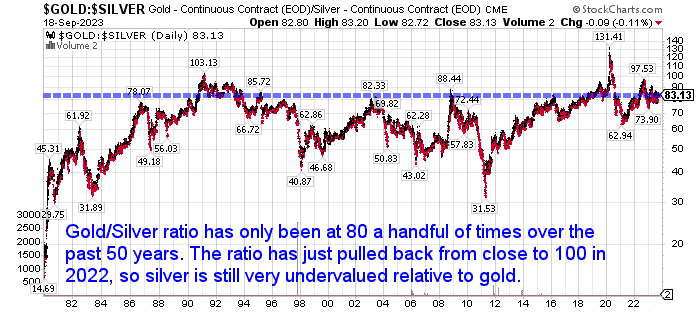
History shows that the ratio doesn’t usually stay at these extreme levels for very long. So at some point we will likely see silver play catch up to gold.
For more on the gold to silver ratio check out: What is the Gold to Silver Ratio?
Also this weekly newsletter of ours showed the benefits of: Using the Gold Silver Ratio to Time Buying Silver
Our long term target for the gold:silver ratio remains somewhere around 10. That is, it will overshoot the previous lows which you can see in the long term Gold/Silver ratio chart below.
At todays gold price of NZ$3271, that would put silver at NZ$327 per ounce! So potentially silver has a lot of upside ahead in this next move higher.
Housing to Gold Ratio
The Housing to Gold Ratio is a measure of how many ounces of gold it takes to buy the median house price in New Zealand.
Today we’ll take a snapshot of where the NZ housing to Gold Ratio sits currently and compare this to the past in the old chart below. (For more on the NZ housing to gold ratio see this article.)
As of the latest data at the end of August 2023, the median NZ house price had dropped to $767,000. While gold in NZ dollars was at $3200.
So the NZ housing to gold ratio at the end of August 2023 was 240 ounces ($767,000 / $3,200 = 240 ounces). Down 17 ounces from 257 ounces in January. So it takes 17 oz of gold less to buy the New Zealand median house than it did at the start of the year.
Here’s a chart showing the NZ Housing to Gold Ratio since 1962.
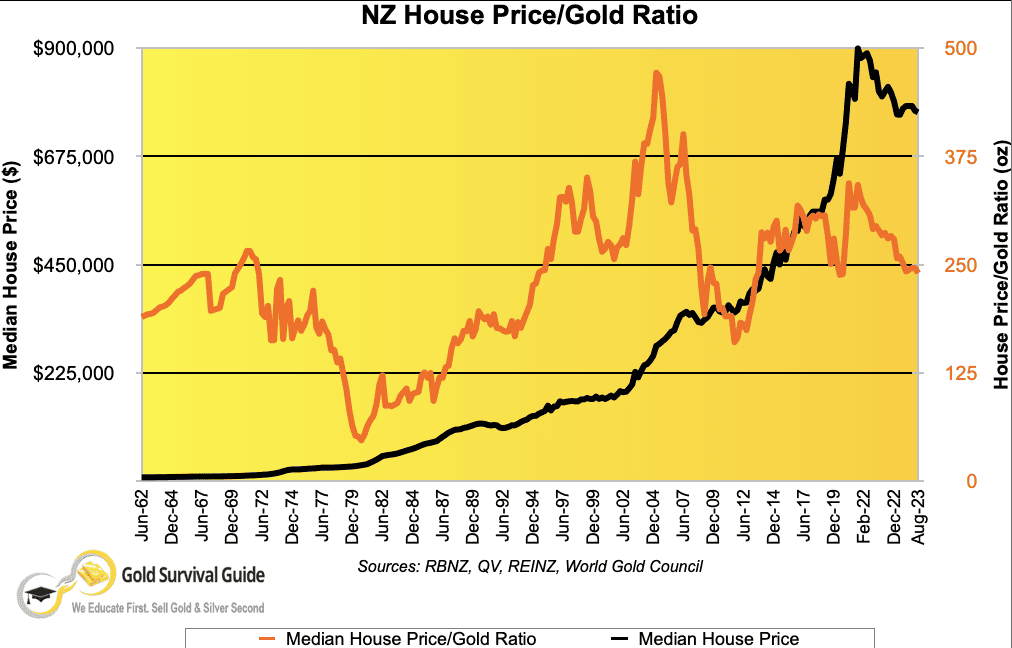
The Ratio reached a peak near 500 as the pre-2008 housing boom saw house prices skyrocket in New Zealand. The ratio of median house price to gold then fell as house prices stagnated and gold conversely rose through to 2011.
The ratio then rose again, topping out in 2021. It has been steadily trending lower since then. With gold prices rising faster than New Zealand house prices since November 2021. As shown in the chart, 240 is the lowest the ratio has been for a number of years.
So after getting back up into the 300’s in 2021, the ratio is now down to the mid 200’s.
Still a long way off the low of 50 in 1980. 100 is probably the number to look out for we’re guessing.
NZ Housing to Gold Ratio Still Above the 2010 Low
The NZ Housing to Gold Ratio still remains up from the low it reached of 200 ounces in 2010.
If history repeats we might even see this ratio head back down well below 100 ounces like it did in 1980. (See the lowest point of the orange line in the chart. Where the ratio bottomed out at 55 ounces to buy the median house price in 1980).
Your gold would buy an awful lot more house if the ratio was once again to head below 100 ounces. With the talk of house prices likely having bottomed it may seem hard to believe it could happen.
But, like we said earlier with regards to the Dow Gold Ratio, the housing to gold ratio could fall simply due to gold rising faster than house prices, as gold did in the 1970’s. Therefore a lower ratio doesn’t solely reply upon falling house prices.
Oktoberfest Beer to Gold Ratio!
Here’s another gold ratio that we’ve been keeping an eye on. Care of our friend Ronnie Stoeferle at Incrementum. It’s the Oktoberfest Beer to Gold ratio!
Why not measure the value of beer in gold or gold in beer! A staple “food” product is consistent across the decades. So is therefore a nice uniform comparison we can make.
The gold/Oktoberfest beer ratio expresses how many Maß of beer (the traditional Bavarian one-litre mug), can be bought with one ounce of gold…
“Last year, visitors to the Oktoberfest had to pay up to EUR 13.80 for one liter of Bavarian beer, brewed in adherence to the German Reinheitsgebot. So the only hope left in times of significantly elevated inflation is that the price of beer will not exceed the psychologically important mark of 15 euros. We therefore expect the Maßpreis to rise to EUR 14.90, which corresponds to an increase of 8.0%, which is rather moderate in times like these.
Gold investors, however, can be relaxed about the recent price increases. And gold has not only maintained its beer purchasing power over the last 12 months, the gold/Oktoberfest beer ratio even increased slightly from 121 to 123 Maß Oktoberfestbier, despite the price increases in euros. So even in times of inflation, the beer lover with an affinity for gold is not left high and dry.”
Source.

Measured against the historical average of 90 Maß/Ounce, the “beer purchasing power” of gold at 123 Maß/Ounce is now well above the long-term average. However, we are still well away from the historic high of 227 Maß per ounce of gold in 1980.
Therefore, much like our other measures, such as Housing to gold and Dow to Gold ratios, the Beer ratio is also telling us that gold is still some way from reaching its full valuation.
Gold Ratio Conclusion
Both the Dow to Gold ratio and Housing to Gold ratio seem to have peaked out. So we may already be witnessing gold bouncing back compared to shares and housing. Likewise silver may also have bottomed out in comparison to gold. So we could be in the early stages of a silver comeback.
So now is likely a good time to purchase either silver or gold as a long term hold. Go here to buy gold or silver now.
Related – Learn more about when to buy gold and silver see: When to Buy Gold or Silver: The Ultimate Guide
Editors Note: This article was first published 15 May 2018. Last updated 19 September 2023 including all new charts for each ratio and new commentary for each ratio and where they may be heading now.
Pingback: Gold and Silver ChartFest - Update for 2016 - Gold Survival Guide
Pingback: Gold and Silver Chart-fest
Pingback: What Percentage of Gold and Silver Should Be in My Portfolio? - Gold Survival Guide
Pingback: Has the Silver Breakout Started? Why a Short Squeeze Could be Developing - Gold Survival Guide
Pingback: New: The Beer to Gold Ratio! - Gold Survival Guide
Pingback: Are the Federal Reserve’s “Temporary” Money Injections Becoming Permanent? - Gold Survival Guide
Pingback: ASB Thinks the RBNZ Will Also Expand QE in May - Gold Survival Guide
Pingback: Is it Too Late to Buy Gold? [Video] - Gold Survival Guide
Pingback: What Price Could Silver Reach? - Gold Survival Guide