Here’s a great question from a reader on gold versus shares. It’s worth reviewing this as last time we looked at this in November 2021 the US stock market had just hit a new all time high.
You’ll see why perhaps you shouldn’t simply compare shares/stocks to gold over a long period of time and then use this as an argument not to buy gold. You’ll also learn all about the Dow Gold Ratio and what shares/stocks might do now…
Table of contents
Estimated reading time: 9 minutes
QUESTION: Often you see the comparison of how currency, example a dollar bill is eventually worth nothing and gold bought at the same price gains in value but it seems that this is not fair because really the comparison has to be if you invested that dollar in say stocks. So how does gold compare say to the Dow for 100 years?
So How Does Gold Compare to the Dow For the Past 100 Years?
We look at the comparison of gold to dollars/euro/yen etc as being the more valid, as they are all forms of money.
We don’t really see gold as an investment, more as financial insurance.
So we consider holding gold is an alternative to holding cash. If we have money in the bank then we hold gold as an insurance policy against that money. And at times the “risk” is greater, so it makes sense to hold more gold than cash. The current period since about the year 2000ish we see as one of those periods (and right now with the recent high profile bank failures in the USA might be an even higher risk time).
We look at our gold holdings as “cash”, and then consider whether to invest a portion of savings into other investments such as shares, property etc.
Shares Should Outperform Gold Over the Long Term
You’d expect shares to outperform gold over the very long term as they are investments that produce a yield (hopefully!) in the form of dividends. So they should go up in value over time, or perhaps not go up in value but produce a yield instead.
Ideally money should simply hold its value over the long term. That is where fiat currency – today’s money – performs terribly. And where gold performs remarkably well – even over centuries.
So instead of using dollars (or whatever your national currency is) to compare the performance of gold and stocks, we prefer to use gold to measure and compare the performance of money and stocks.
Compare Gold with Stocks Using the Dow/Gold Ratio
A good way of comparing shares (a.k.a. stocks) and gold is with the Dow Gold Ratio.
What is the Dow Gold Ratio?
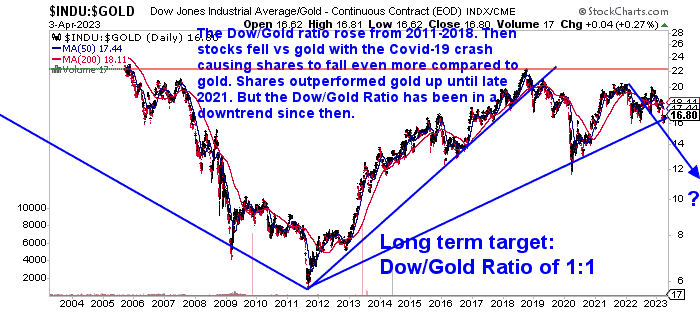
The Dow Gold Ratio is the value of the US stock market Dow Jones Index, divided by the US Dollar price of 1 ounce of gold. At today’s prices that would be 33,601 / $1,983 = 16.94.
[Back when we last looked at this measure in early November 2021 the ratio was 35,914 / $1,791 = 20.05]This lets us see how one moves versus the other in cycles. We can plot it on a chart and see the changes in trend.
So if you wanted to “make more” over 100 years, shares should outperform gold. But at certain times, gold will likely do better than shares.
In the 200 year chart of the Dow Gold Ratio below, it shows these cycles quite clearly. There are times when it makes real sense to be more heavily in shares (see: Stocks Low Gold High). And other times when gold should be overweight (see: Stocks High Gold Low).
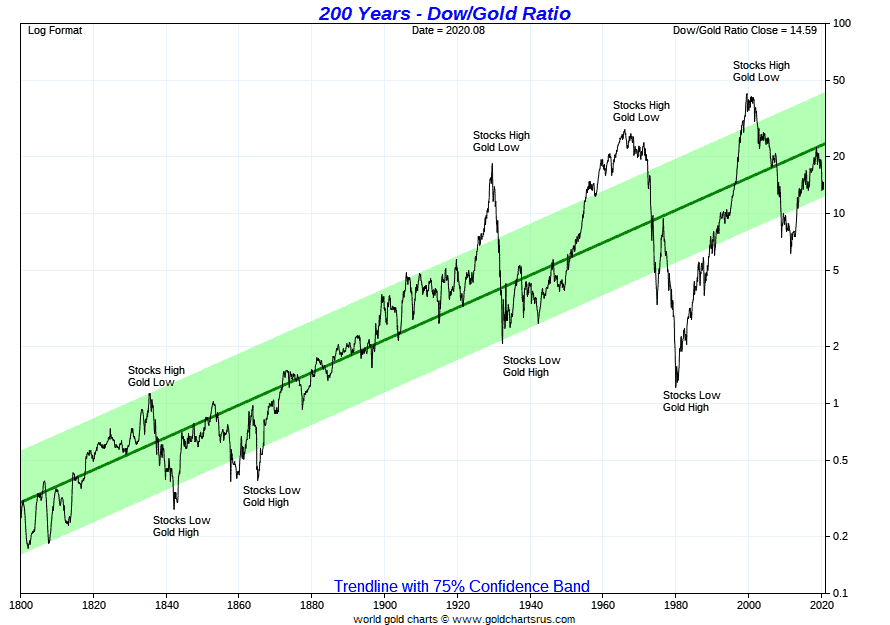
If we look back 100 years to 1918 then the Dow/Gold Ratio was around 3. This means it took 3 ounces of gold to “buy” the Dow Jones index.
So if the ratio is higher than it was in 1918, then stocks would have returned more than gold. If it is below then gold performed better than the Dow.
Therefore with the ratio currently at 17, the Dow has since 1918, returned more than gold. As noted earlier this is not really unexpected.
However at times (around the 1930’s and 1980) the ratio fell below 3. So at these two periods in time, gold had actually gained in value since 1918, when compared to stocks.
But given we’re now in 2023, the perhaps more valid question to ask is:
How Might Gold Do Versus Stocks Over the Next Decade or So?
Our belief is that since the year 2000 gold has been in a “bull market” (albeit a secular bull market interrupted by cyclical bear market from 2011 to 2014). We further believe that this bull market will end with a change to the current monetary system.
Perhaps gold will be a part of that change officially, perhaps not.
But we believe gold will be revalued upwards against today’s fiat currencies and many other assets including shares or stocks. (Or perhaps more correctly put, these currencies and assets will be revalued down versus gold).
This revaluation could be done officially and even happen overnight. Or it could just be driven by market forces and happen steadily over many years. Or perhaps even a bit of both?
Let’s go back to our long term Dow / Gold chart. This version has a couple of trend-lines added in red.
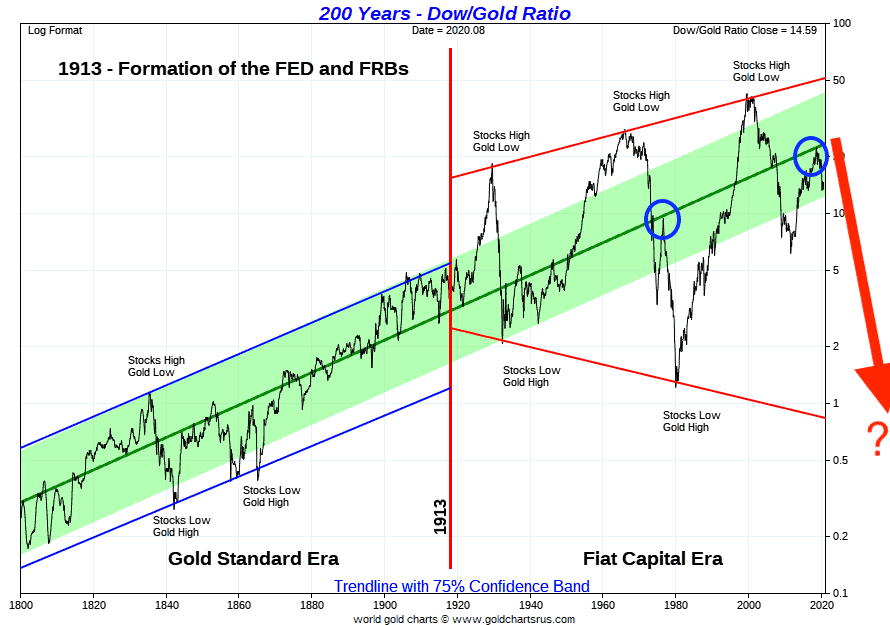
These trend-lines (perhaps not coincidentally) go back to around the time of the Great Depression. This was when gold was removed from everyday circulation in the US monetary system (1933). The expansion of this trading range in the ratio since that time, reflects that the “volatility” in the monetary system has increased.
Also of note was that 1913 (vertical red line) saw the creation of US Federal Reserve. A decade or so after this, was also the first time the Dow to Gold Ratio went significantly outside the light green shaded area. This was the trading range the Dow Gold Ratio had moved in for the previous 100 years, under the classical gold standard. So a bit of proof that the classical gold standard did keep prices pretty stable.
Read more: The Gold Standard and a Free Market For Money >>
Since 1913 – the age of central banks – we have seen these large swings in value of the Dow/Gold ratio. The highs getting higher and the lows getting lower.
The Dow Gold Ratio May Make a New Low
Look at how the ratio has bounced up and down between the 2 red trend lines. Given this range, it’s not completely unreasonable to think that the ratio may end up at a new low at the completion of the current gold bull market. Perhaps somewhere below 1? Indicated by the red arrow and question mark in the chart above.
Remember if the ratio was 1:1 that would mean 1 ounce of gold would buy all the stocks in the Dow Jones Industrial Average. So if the Dow remained at today’s number of around 33,601, gold would have to rise to $33,601 per ounce to result in a ratio of 1:1.
This was exactly what happened at the end of the 1980’s precious metals bull market. Where the Dow Gold Ratio bottomed out at 1.
We’ve previously wondered whether the phase from 2011-2018, where the ratio moved up from around 6 or 7 to 21, could well just be a smaller up-cycle? Much like that which occurred in the mid 1970’s. Before a resumption of the longer term downwards trend in the ratio.
See in the 200 year chart above, how the ratio touched the dark green line in the middle of the light green trading range (refer to the blue circles). In 1976 the ratio also touched this dark green line before then resuming its downtrend back close to 1.
Following the share market crash, early in the Covid-19 panic in 2020, shares actually bounced back. As a result, the ratio is got back close to 22.5. (Note: this isn’t shown on the 200 year charts above as they only go up until August 2020. See the chart below instead).
Back in 2021 we wondered if the ratio may struggle to get above the red line at 22.5? Indeed that has proven to be the case. The ratio has instead once again turn down lower. Meaning gold has been outperforming the Dow Jones index/shares since late 2021. Back then the media was filled with news of the sharemarket, with Tesla hitting all time highs too. We wondered back then if shares may be due for a correction at least. That proved to be the case.
Recently the sharemarket has been a bit stronger. However we think that before too long the sharemarket is likely to resume falling. And if gold continues to rise as it has done since the bank failures, then that would make now a good time to own gold over stocks/shares, for perhaps the next 10 years. Of course shares could still rise in dollar terms from here, especially if central banks implement more currency printing to bail out failing banks. But gold could then “rise” more to result in a lower ratio.
See what gold products are available today: Buy Gold.
What do you think? Let us know in the comments below…
Read more: Wages from Ancient Greece and NZ Housing Both Say Silver Undervalued by a Factor of 20 >>
Editors Note: This post was originally published 27 June 2017. Last Updated 4 April 2023 to include latest 200 year charts and to include a 20 year Dow Gold chart. Along with latest numbers for Dow Gold Ratio.
Pingback: Gold and Silver Technical Analysis: The Ultimate Beginners Guide - Gold Survival Guide
Pingback: How Do You Value Gold - What Price Could it Reach?
Pingback: Gold Ratios Update: Dow/Gold, NZ Housing to Gold, & Gold/Silver Ratio - Gold Survival Guide
Pingback: Gold Cycles vs Property Cycles: When Will Gold Reach Peak Valuation? - Gold Survival Guide
Pingback: Good Time to Sell NZ Shares and Buy Gold or Silver?
Pingback: Gold Mining Shares vs Physical Gold Bullion - Gold Survival Guide
Pingback: Why Buffett is (Still) Wrong About Gold - But How He Loves Silver - Gold Survival Guide
Pingback: When Will You Know It's Time to Sell Gold?
Pingback: NZD Gold Makes New All Time High - Rising With Hardly a Pause - What to Do? - Gold Survival Guide
Pingback: Update on Bullion in New Zealand Post Lock Down - Gold Survival Guide
Pingback: Extreme Monetary Policy Now the New Normal in New Zealand Too? - Gold Survival Guide
Pingback: Is it Too Late to Buy Gold? [Video] - Gold Survival Guide
Pingback: Greed Index is Approaching Extremes - Gold Survival Guide
Pingback: If New Zealand Introduces a Central Bank Digital Currency, How Will Gold or Silver Be Valued and How Will One Use Them? - Gold Survival Guide
Pingback: Why Buy Gold? Here's 15 Reasons to Buy Gold Now
Pingback: Gold vs Stocks: Historical Returns - Gold Survival Guide
Pingback: What Percentage of Gold and Silver Should Be in My Portfolio? [2023 Update] - Gold Survival Guide
Pingback: The (Not So) Slow Death of the Dollar - 9 Recent Indicators of the Dollars Demise - Gold Survival Guide
Pingback: New Zealand Share Market Hits 16 month Low - Gold Survival Guide