Sounds amazing and at first glance seems quite unlikely we’d agree. But, what labourers were paid in silver in ancient Greece, and New Zealand house prices when measured in silver, both show how very undervalued silver is currently. We’ll show just how eerily similar the resulting numbers are…
Table of Contents
Estimated reading time: 5 minutes
We previously compared ancient wages in silver and NZ house values in our weekly newsletter. However we realized we could have explained the concept better. So we’ve expanded upon it here.
Silver Very Undervalued From Historical Perspective of Ancient Greece
Perhaps you have seen historical references to what silver bought in the past?
We have too on occasion. In fact we wrote about this a number of years ago. There’s some amazing facts about silver in this article:
Interesting Historical Comparisons in the Valuation of Silver
Such as how the Bible says Jesus was betrayed for 15 ounces of silver. At today’s prices this would only be about NZ$780!
Anyhow, we were inspired to write this as a result of an excellent article by Dominic Frisby. He outlined what the average labourer has been paid in silver over many different periods in history.
Frisby notes:
“To compare modern and ancient prices might seem like a ridiculous and redundant exercise – the two worlds are so different – but there is a point to all this. Measured in silver, salaries actually remained fairly constant until the 20th century.”
Here’s an outline of the full Frisby article care of BMG.
“Frisby looks at the wages paid in ancient Athens (450BC), because it tells us a lot about the silver price today.
The Athenian talent, about 26 kg of silver, could purchase nine years of a skilled man’s labour. If we assume 250 working days in a year, that works out to about 11.5 grams of silver per day, or a little under 0.3 of a troy ounce.
A kilo of silver today is about £460, so nine years’ skilled labour would be about £12,000 in today’s money. That makes a year’s skilled labour about £1,333, and a day’s £5.29.
Today, the average wage in the UK construction industry is about £30,000 per annum, or £120 per day. Today’s British labourer is earning considerably more than his ancient Athenian counterpart.
The Babylonian worker might have earned 2 grams of silver (92p). The Roman unskilled worker, like the Greek, might have earned 4.2 grams of silver, at least until Romans started chipping their coins.
The wages of the medieval English worker had fallen back towards Babylonian levels by 1300. He got 2.8 grams, while a skilled city craftsman might have expected 5.6 grams, about half what an Athenian was paid.
By the 19th century, the skilled labourer might be looking at around 24 grams of silver per day. The 19th century labourer was getting about double the pay of his 450 BC Athenian counterpart.
Compare that to today. Frisby used £30,000, the average wage of a construction worker, or £120 per day. That amounts to 260 grams of silver, compared to 11.5 grams for the Athenian worker. Today’s pay dwarfs that of any pre-20th century worker in history.
Wages have risen, but not by this much relative to the cost of living, status and so on within a society. It’s not that wages have soared; it’s that silver, having no monetary role, has become cheap, historically and geologically.
If today’s wages of £120 were to equal the Athenian equivalent of 12 grams, silver should be £10 per gram. That’s over 20 times higher than today’s silver price of $18.50 an ounce—more like $400 per ounce. At $400 per ounce, not only do wages correspond, so does the cost of constructing ships or city buildings.
One day we will see silver reverting to its historical mean, and we should all prepare.”
Here’s the full article which also details Frisby’s allowances made for the likes of modern taxation and cost of living changes. Highly worth a read: What wages in ancient Athens can tell us about the silver price today. Also note that compared to when Frisby originally wrote his article, silver prices have risen from US$18.50 to US$30 today. So $400 per ounce is about 13.3 times more than the current price, down from the 20 times when Frisby wrote this. But still very undervalued historically.
How Does NZ Housing to Silver Ratio Compare to Frisby’s Wages Valuation?
Very interestingly, Frisby’s wage numbers can also be compared to other methods of valuing silver.
You’ll recall he concluded silver should be over 20 times higher than the current price (currently more like 13.3). Not just when based upon wages, but also upon the cost of constructing buildings and ships too.
So we thought we’d compare Frisby’s numbers to the New Zealand housing to Silver ratio.
What’s that?
Simply the price of the median New Zealand house, divided by the price for one ounce of silver. This results in the number of ounces of silver it takes to buy the median house.
So at current prices (or end of September 2024 which is the most recent median house price data available) this would be:
$780,000.00 divided by $48.44 /oz equals 16,101 ounces of silver to buy the median New Zealand house.
That number on its own doesn’t really tell us much. We have to cast our eye back to some historical numbers to glean further insights.
Luckily we’ve already done this in a previous post:
NZ Housing to Silver Ratio 1968 – 2024 – Measuring NZ House Prices in Silver
We plotted the NZ Housing/Silver ratio out from 1968 and arrived at the chart below.
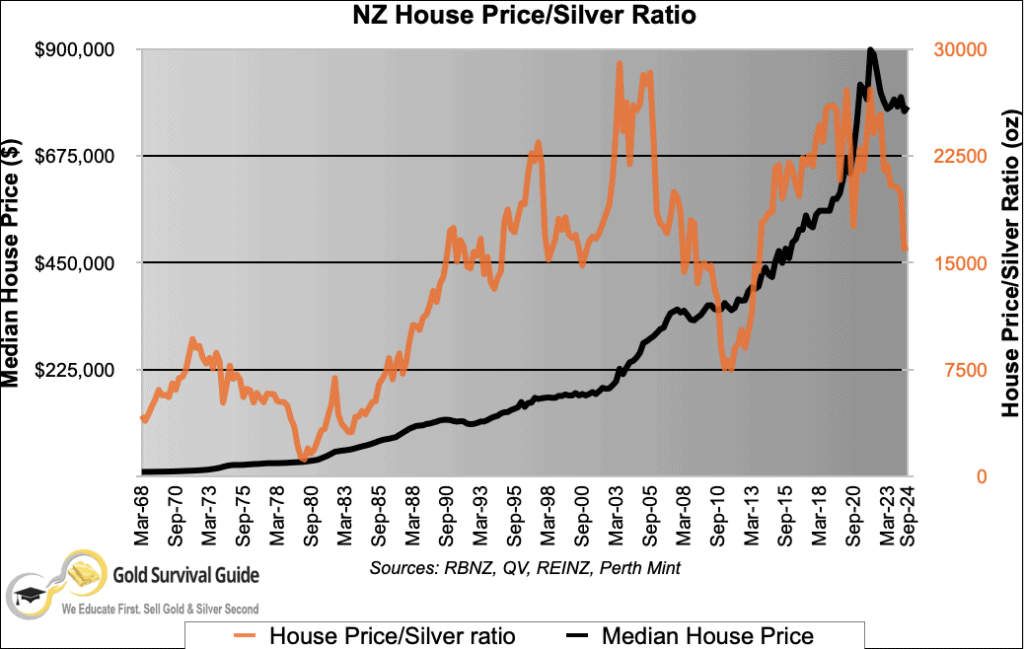
Anyway, to explain the chart more fully…
The black line is the median house price (left axis). It has shot up from just under $700,000 in mid 2020 to reach $900,000 as of December 2021. Before dropping down to as low as $762,500 in January 2023.
The orange line and left axis is the housing/silver ratio in ounces. It too pushed higher from 2011. Getting as high as 27,000 as of March 2020. Before dipping down to as low as 17,000 in the September 2020 quarter. Then back up again to 27,000 ozs in December 2021. As noted already as of September 2024 it is at 16,101 ounces (as calculated above).
The key point to take note of is where the ratio bottomed out at in 1980. (See the lowest point of the orange line).
Why 1980?
Because this was the end of the last precious metals bull market of the 1970’s. The ratio in 1980 actually dropped almost as low as 1000 ounces of silver to buy the median NZ house.
Do you notice anything about that number?
What if you compare 1,000 to 16,000?
The current ratio compared to the end of the last bull market differs by a factor of around 16.
That is, for the same amount of a silver to buy the same house as it did in 1980, silver needs to go up by a factor of 16!
Which is not far off the rise of 13.3 (updated to 2024 numbers) which Dominic Frisby calculated was required to return wages in silver to their (very) long standing historical average. So whether you’re comparing silver to labour or to housing you get similar very undervalued numbers.
Will Silver Return to That Level in the Future? i.e. Go Up By 13 to 16 times the Current Price?
Who knows?
But the fact these comparisons match so closely gives them both some weight.
They both certainly show that silver remains very undervalued. Even if it doesn’t go up by 13 or 16 times the current price, there certainly seems to be plenty of potential upside ahead.
The long term chart below shows there still some upside just to get back to where silver was in 2011.

So if you buy silver today, there’s a good chance it will have significantly more buying power in the years ahead.
Sign up to our daily price alerts to see more charts like these. Especially useful if you are looking at buying and want get in at a decent level.
Get access to your Gold & Silver Daily Price Alert here.
Editors Note: This article was first published 17 March 2017. Last updated 3 December 2024. Including latest numbers for housing to silver ratio and updated charts.

Glenn's dedication to educating individuals on wealth protection through precious metals has helped over 2400 clients from New Zealand, Australia, USA and Europe to safeguard their financial futures. Passionate about financial independence and lifestyle freedom, Glenn’s mission is to empower others with the knowledge and tools to thrive in today’s volatile economic environment. When he's not advising on precious metals, Glenn enjoys spending time with his family and pursuing outdoor adventures.
Education: University of Auckland Bachelor of Science
Linkedin: https://www.linkedin.com/in/glenn-thomas-0984a4310/
- Why You Should Become Your Own Central Bank - June 28, 2026
- John Butler, Josh Phair And The Case For Gradual Monetary Change - June 24, 2026
- What Could A Global Currency Reset Mean For New Zealand? - June 19, 2026