The housing to silver ratio shows that when priced in silver, New Zealand median house prices have fallen almost 29% since 2003. But you’ll also see how history shows you could potentially buy a median priced house in New Zealand for only $48,404…
Table of Contents
You may have read our article on the NZ housing to gold ratio. We outlined there, how when priced in gold, New Zealand house prices could fall 79%. So we’ve done the same for silver and the numbers show even more upside potential.
What is the Housing to Silver Ratio?
Firstly, here’s how to calculate the house price to silver price ratio.
The housing/silver ratio is simply the median house price divided by the current silver price. The resulting number shows how many ounces of silver it takes to buy the median New Zealand house at a given point in time.
For example, as of the end of December 2023:
Median NZ house price of $780,000 divided by $38.42 /oz equals 20,303 ounces.
So it took 20,303 ounces of silver to buy the median priced New Zealand house as of December 2023.
We can then use the historical data to compare how overvalued or undervalued silver is compared to housing.
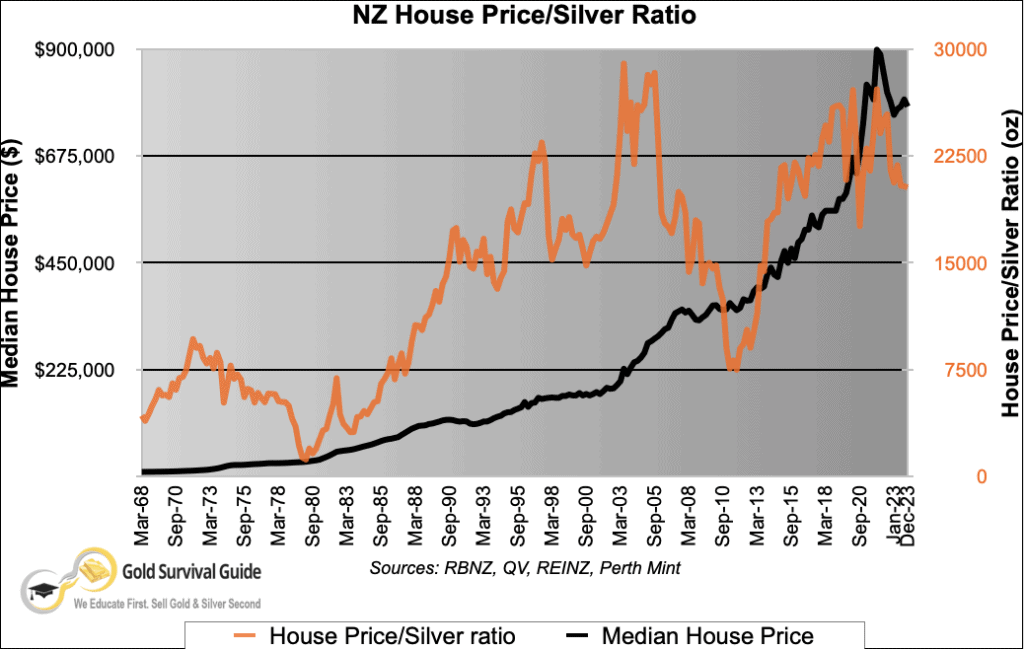
The below chart shows the median New Zealand house price since 1968. See the black line and left hand axis. Along with NZ housing to silver ratio – the orange line and right hand axis.
So the orange line shows us exactly how many ounces of silver it took to purchase the median priced house in New Zealand over the past 55 years.
How Have NZ House Prices Varied Over the Past 55 Years When Priced in Silver?
NZ Housing to Silver Ratio Bottomed in 1980 at 1000 ozs
The above chart shows that at the end of the 1970’s precious metals bull market, it took around 1000 ozs of silver to buy the median New Zealand house (see the lowest point on the orange line).
To be specific, in March 1980 it took 1158 ounces. However our house price index data back then was only quarterly. The NZ silver price averaged $25.89 during March. Whereas the silver price peaked in January 1980 where it averaged $39.78. So this would have pushed the housing to silver ratio down under 1000 ounces.
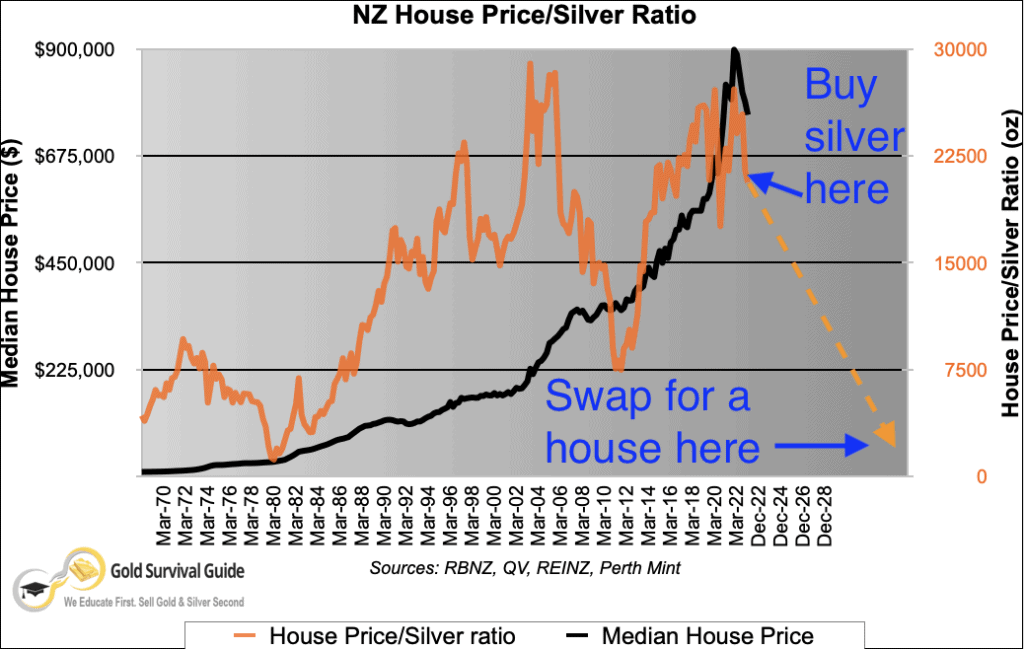
Therefore anywhere close to 1000 ounces is likely to be a very good time to trade silver for property.
The Ratio Peaked in 2003-2005 at Almost 30,000 ozs
The ratio rose right through to the mid 2000’s where it took just under 30,000 ounces of silver to buy a median priced house in New Zealand. So silver was very cheap in New Zealand then! (Or was housing expensive?)
How Many Ounces of Silver to Buy the Average NZ House Today?
The ratio got back up to as high as 27,000 ounces in March 2020. That was when silver crashed briefly during the Covid-19 panic. It then fell back to 17,500 in September 2020.
With the national median house price jumping sharply from September 2020 to December 2021, the NZ housing to silver ratio then got back up up to just over 27,000 oz’s.
Since then the median house price has fallen back to $780,000 and silver prices have risen over $5 per ounce. So the housing to silver ratio has dropped back to 20303 ounces. But it still has a long way to fall to get back close to 1000 oz’s.
How Does the Housing to Silver Ratio in New Zealand Compare to the USA?
We were originally inspired into crunching the numbers on silver versus housing here in NZ, after posting an article from Casey Research “The Silver/Housing Ratio: How to Buy a Vacation Home”
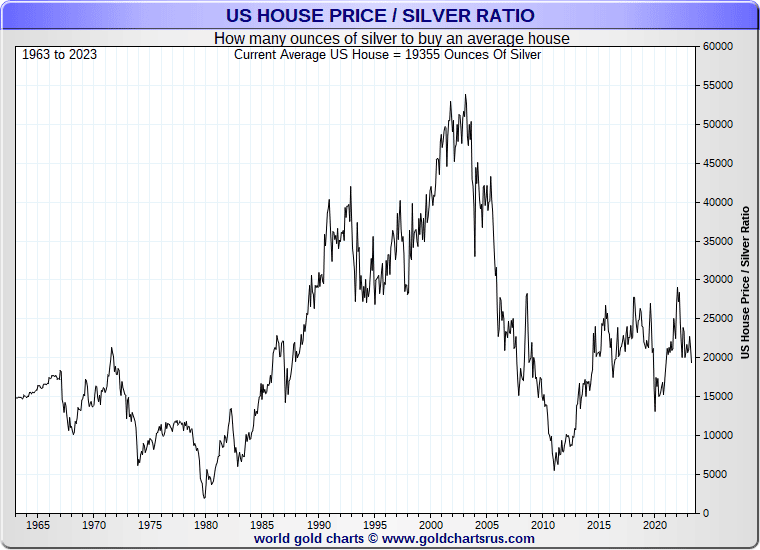
In the USA in January 1980, housing bottomed against silver at 1258 oz’s. So the numbers are quite similar to our own. The US housing bubble saw the ratio reach a much higher number in the mid 2000’s. The chart below from the excellent Goldchartsrus.com shows that in 2023 it takes 19,355 ounces of silver to buy the average USA house.So this is very similar to what the New Zealand ratio is at 20,302.
Also just like here in New Zealand, house prices might have gone up during the inflationary 1970’s, but in silver terms (just as in gold), they actually went down overall in that decade.
This is shown clearly in our chart. See how from 1970 to 1980 the black median house price line was gently rising. While the orange housing to silver ratio line was steadily falling. Albeit with a correction in the mid 1970s. The falling housing to silver ratio shows silver was rising in price faster than house prices during this period.
Here’s Another Way of Thinking About Silver…
How to Buy a Median Priced House in NZ Freehold, for Only $44,815…
A sensational headline alright we agree. And just like the headlines in the NZ Woman’s Weekly (or in most of the mainstream news websites these days for that matter!), there is more to it than meets the eye. But it’s a basic premise that we want to demonstrate.
It’s the concept of how moving from one asset class into another at the right time can have a profound impact upon your wealth.
Sold! – to the Guy at the Back With 1158 Ounces of Silver!
Here’s the premise for our rather sensational headline today…
1. You buy 1158 oz’s of silver today at NZ$41.80 per ounce (in the form of 5oz bars) for a total purchase of $48,404.
2. History repeats, and the housing to silver ratio again heads down towards 1158 ozs in the coming years,
3. Eventually you may be able to buy a median priced New Zealand house with that 1158 ounces of silver (or $48,404 – in today’s terms – worth of silver).
4. Voila – a house for $48,404!
Granted we haven’t taken into account that you’ll possibly get slightly under the spot price of silver when you sell it. Also it will no doubt be difficult to pick the absolute bottom in the ratio. Nonetheless, the exercise demonstrates that silver is likely still very undervalued on a historical basis, comparatively to property at least.
Is the 1970’s Repeating?
To our eye the 1970’s do seem to be repeating currently. Albeit in a much more drawn out fashion.
Check out the New Zealand housing to silver ratio chart from late 1973. The ratio went from 8,700 down to 5,200 oz in March 1974. But then rose back up to 7,800 in September 1974. Before then continuing to fall for the rest of the decade.
We think we have seen a similar process play out, but in a much more drawn out timeframe, from 2004 through to today. The ratio peaked in 2004 then fell sharply down into 2011, before then rising back up close to the 2004 high.
So at the end of December 2021 NZ housing was almost as expensive to buy in silver terms as it was in 2004! Since then the ratio has come back down. As noted already the housing to silver ratio is back down to 20,303 oz at the end of December 2023. So maybe the ratio is at the beginning of the next leg down?
If so, and if history repeats, house prices could have 94% further to fall yet! (When priced in silver). We could be wrong of course but it makes for an interesting speculation we reckon.
Got a spare $48,404 lying around? Buy some silver today.
Editors Note: This post was first published 29 March 2011. Last Updated 12 February 2024. With new charts, latest numbers and expanded commentary.
Pingback: Price It In GOLD And SILVER Before You Believe What You Hear About Global Stock Market Recoveries | Gold Prices | Gold Investing Guide
Pingback: Housing Un-affordability: It’s Not Supply, It’s the Debt Stupid! | Gold Prices | Gold Investing Guide
Pingback: Should I sell my home and buy precious metals? | Gold Prices | Gold Investing Guide
Pingback: Will NZ Banks Buy Gold? | Gold Prices | Gold Investing Guide
Pingback: Exit Strategies For When the Time Comes to Sell Gold and Silver | Gold Prices | Gold Investing Guide
Pingback: What Good is a Bar of Gold When the Shelves are Empty? - Gold Prices | Gold Investing Guide
Pingback: Wages from Ancient Greece and NZ Housing Both Say Silver Undervalued by a Factor of 20 - Gold Survival Guide
Pingback: Gold and Silver Technical Analysis: The Ultimate Beginners Guide - Gold Survival Guide
Pingback: NZ Housing to Gold Ratio 1962 - 2019: Measuring House Prices in Gold
Pingback: Wages from Ancient Greece and NZ Housing: Both Say Silver Undervalued by a Factor of 20 - Gold Survival Guide
Pingback: How Do Chinese Thought Leaders See the Monetary System Changing? - Gold Survival Guide
Pingback: Why Buy Gold? No Fiat Currency Lasts Forever - Even the NZ Dollar. Devalued 7 Times in 17 Years... - Gold Survival Guide
Pingback: NZ Government Bonds Go Negative - A Taste of What’s to Come - Gold Survival Guide
Pingback: Does the NZ Government Debt Matter? - Gold Survival Guide
Pingback: Record Gold Imports into New Zealand as Investors Seek Haven - Gold Survival Guide
Pingback: Will New Zealand Property Prices Ever Fall? - Gold Survival Guide
Pingback: What Percentage of Gold and Silver Should Be in My Portfolio? [2021 Update] - Gold Survival Guide
Pingback: If New Zealand Introduces a Central Bank Digital Currency, How Will Gold or Silver Be Valued and How Will One Use Them? - Gold Survival Guide
Pingback: Recession Coming? A Repeat of 1973-74? - Gold Survival Guide
Pingback: Weather, Inflation and a Wage/Price Spiral - Gold Survival Guide
Pingback: What Will the Long Term Impacts of SVB and Signature Bank Bailouts Be? - Gold Survival Guide