Time for an updated look at the Gold to Silver Ratio. Why? Because we think silver may finally be setting up to outperform gold again.
We haven’t looked at the Gold to Silver Ratio in real detail since March 2016. In that post we covered:
- What is the Gold to Silver Ratio?
- How is the Gold to Silver Ratio Used?
- What is the Ratio Telling Us Now?
- Why is the Gold to Silver Ratio at New Highs?
- What to Do Now?
So be sure to check that article out first if the Gold to Silver Ratio is new to you.
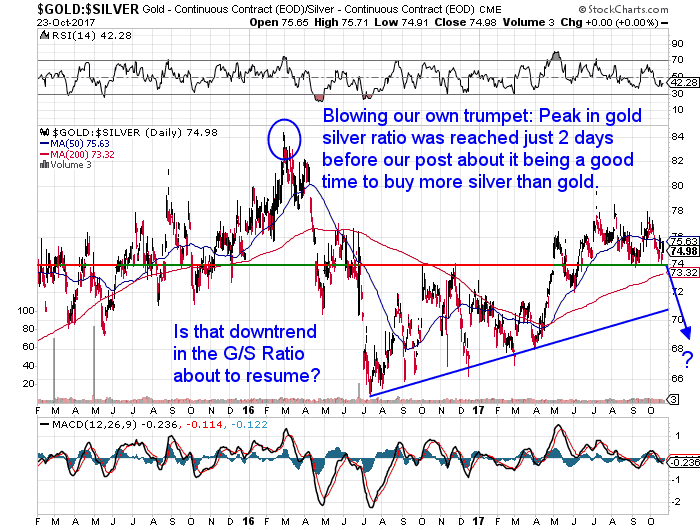
Just to give our trumpet a toot. We managed to get that call pretty right (something we don’t always do that’s for sure!). The Gold to Silver Ratio made an intraday high of 84.38 on 28th February 2016. Just 2 days before our post, where we said:
“…right now the ratio says that silver may be a better buy than gold. So there is a good argument for heavily skewing any purchases in favour of silver.”
This peak in the gold silver ratio can be clearly seen circled in the chart below.
From there the gold silver ratio proceeded to fall sharply over the next 4 months to bottom at 65 in July 2016.
But then for the next year it kept rising. Back up to just below 80 on 7 July 2017.
Since then it has been trading sideways between roughly 74 and 78.

But we’re now again starting to wonder if silver is about to finally outperform gold again? That is, the gold silver ratio may be about to head lower again.
74 has been a line of support. With the Gold Silver ratio bouncing off this 3 times since June.
Related: Could Silver Be Worth More Than Gold?
What to Watch For Now in the Gold to Silver Ratio?
- First we’ll need to see it break this support line at 74.
- Then also get below the 200 day moving average at about 73.30.
- Finally we’ll need the ratio to break below the rising support line currently at about 71.
Gold and Silver Technical Analysis: The Ultimate Beginners Guide]
What Happens to Silver Once This Support Line is Broken?
Let’s zoom out for a much longer term view.

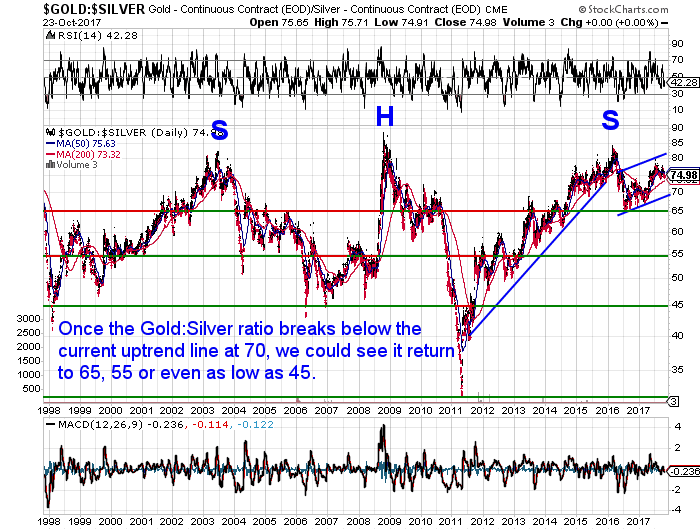
This is the same chart from our March 2016 article showing the “head and shoulders” pattern. A head and shoulders pattern is nothing to do with dandruff!
We won’t drown you in technical mumbo jumbo. But this chart pattern implies the right hand shoulder will eventually return to the point where the left hand shoulder started from. So that would be down in the 40-45 range.
We can also see that in 2011 when silver peaked at US$50 per ounce, the gold silver ratio touched 31. So there is a recent precedent for that level too.
However in the shorter term the points to watch for would be 65, 55 and then 45.
Related: Wages from Ancient Greece and NZ Housing Both Say Silver Undervalued by a Factor of 20
Small Movements in the Gold to Silver Ratio Can Cause Big Shifts in the Price of Silver
Remember that fairly small movements in the gold to silver ratio can correspond to significant moves in the dollar price of silver.
A move just back to the mid range point of 55, with gold not changing price from today’s $1845 would result in a silver price of $33.55. But generally the moves lower in the ratio more often correspond with both metals moving higher in price. So a move to 55 in the ratio would likely mean a larger move in the silver price than to $33.55.
Consider grabbing some silver today. Here’s more on a couple of silver coin options available:
What Use Will Silver Coins be in New Zealand in a Currency Collapse?
Silver Maple Monster Box – The Complete Guide
Or go to our order page to buy silver now.
To learn more about when to buy gold or silver check out this article: When to Buy Gold or Silver: The Ultimate Guide


Pingback: Could Silver Be Worth More Than Gold? - Gold Survival Guide
Pingback: Why is the Gold/Silver Ratio at New Highs?
Pingback: Gold Ratios Update: Dow/Gold, NZ Housing to Gold, & Gold/Silver Ratio - Gold Survival Guide
Pingback: Silver Market Update - Gold Survival Guide