Introduction
For more than 100 years, investors have debated one of the most important questions in wealth building:
Should you own shares, or should you own gold?
At different times in history, each has dramatically outperformed the other. There have been periods when shares generated extraordinary returns and gold lagged behind. At other times, gold significantly outperformed shares and helped preserve wealth during periods of inflation, financial instability and economic uncertainty.
The Dow Gold Ratio is one of the simplest ways to compare the relative performance of these two very different asset classes.
Rather than measuring wealth in dollars, the Dow Gold Ratio measures how many ounces of gold are required to buy the Dow Jones Industrial Average. In doing so, it offers a unique perspective on long-term market cycles and the shifting relationship between financial assets and hard assets.
Many investors use the Dow Gold Ratio to help identify periods when shares may be historically expensive relative to gold, or when gold may be undervalued relative to shares.
In this guide, we’ll explain what the Dow Gold Ratio is, how it works, what 100 years of history can teach us, and what the ratio may be telling investors today.
Quick Answer: Dow Gold Ratio
The Dow Gold Ratio measures how many ounces of gold it takes to buy the Dow Jones Industrial Average.
High ratios usually suggest stocks are expensive relative to gold.
Low ratios often suggest gold is outperforming shares.
Historically, major turning points in the ratio have occurred during:
- financial crises,
- inflationary periods,
- and major monetary system changes.
As of 2026, the ratio has fallen significantly from its 2021 highs, suggesting gold has recently been outperforming stocks.
Table of contents
- Introduction
- Quick Answer: Dow Gold Ratio
- What is the Dow Gold Ratio — and Why Does It Matter?
- Why Investors Follow The Dow Gold Ratio
- Dow Gold Ratio: A Century of Wealth Cycles
- What Causes The Dow Gold Ratio To Rise And Fall?
- Where Is The Dow Gold Ratio Today?
- Long-Term Charts: The Big Picture
- Could The Dow Gold Ratio Return To 1:1?
- How to Use the Dow Gold Ratio in Your Portfolio
- Limitations Of The Dow Gold Ratio
- Dow Gold Ratio vs The S&P 500
- FAQs on the Dow Gold Ratio
- Final Thoughts: Understanding Long-Term Wealth Cycles
Estimated reading time: 13 minutes
What is the Dow Gold Ratio — and Why Does It Matter?
The Dow Gold Ratio is a simple but powerful metric.
It tells you how many ounces of gold it takes to “buy” the Dow Jones Industrial Average.
- Formula: Dow Jones Index ÷ Gold Price (USD)
- Example: If the Dow is at 50,800 and gold is $4,400, the ratio is 11.55
This ratio helps investors compare the relative value of shares vs gold — across decades and even centuries. It highlights when stocks are likely overvalued and when gold may be undervalued — and vice versa.
Think of it as a wealth cycle indicator rather than a short-term trading tool.
Why Investors Follow The Dow Gold Ratio
Most investors measure their wealth in dollars.
The Dow Gold Ratio takes a different approach. Instead of measuring wealth in a currency that can lose purchasing power over time, it compares two major stores of wealth directly: shares and gold.
This can provide valuable insights into long-term market cycles.
When the ratio is rising, shares are generally outperforming gold. When the ratio is falling, gold is generally outperforming shares.
Many investors believe the ratio provides a useful perspective on relative value because it compares shares and gold directly.
For example, both shares and gold can rise in dollar terms at the same time. However, the Dow Gold Ratio reveals which asset is gaining value relative to the other.
Some investors use the ratio as a broad allocation tool, helping them assess whether financial assets or hard assets appear more attractive from a long-term historical perspective.
While the Dow Gold Ratio should never be used as a precise market timing tool, it can provide useful context when evaluating where we may be in the broader investment cycle.
Dow Gold Ratio: A Century of Wealth Cycles
For more than 100 years, the Dow Gold Ratio has swung in long cycles:
| Year | Stocks High or Gold High? | Ratio |
|---|---|---|
| 1929 | Stocks Peak (Before Crash) | ~18 |
| 1932 | Gold Peak / Stocks Crash | ~2 |
| 1980 | Gold Peak (Crisis + Inflation) | <1 |
| 1999 | Dotcom Bubble – Stocks Peak | >40 |
| 2011 | Gold Peak (Post-GFC) | ~6 |
| 2026 | Stocks High, Gold Regaining Ground | ~11.50 |
Interestingly, several major peaks and troughs in the Dow Gold Ratio occurred near important turning points in financial markets. While the ratio should never be used as a precise timing tool, history suggests it can provide useful context when assessing long-term market cycles.
What Causes The Dow Gold Ratio To Rise And Fall?
The Dow Gold Ratio is not random. Over the past century, major moves in the ratio have generally reflected changing investor preferences between financial assets and hard assets.
When confidence in the economy, financial markets and monetary system is high, investors often favour shares over gold. During these periods the Dow Gold Ratio tends to rise.
When confidence begins to weaken, inflation accelerates, debt levels become a concern or financial instability emerges, investors often seek the perceived safety of gold. During these periods the ratio tends to fall.
When The Dow Gold Ratio Rises
The ratio typically rises during periods characterised by:
- Strong economic growth
- Rising corporate profits
- Expanding credit and debt
- High investor confidence
- Low inflation
- Strong stock market performance
Examples include the 1920s, much of the 1980s and 1990s, and parts of the period from 2011 to 2021.
During these times investors generally prefer productive financial assets such as shares because confidence in future economic growth is high.
When The Dow Gold Ratio Falls
The ratio has historically fallen during periods characterised by:
- Inflation and currency debasement
- Banking and financial crises
- Excessive debt accumulation
- Recessions and economic uncertainty
- Loss of confidence in financial markets
- Rising demand for hard assets
Examples include the Great Depression, the inflationary 1970s, the period following the Dot-Com crash, and parts of the current cycle.
During these periods investors often place greater value on preserving wealth than maximising returns. Gold tends to benefit because it is viewed as a monetary asset and store of value that sits outside the financial system.
The Bigger Picture
Viewed through this lens, the Dow Gold Ratio can be thought of as a measure of confidence.
When confidence in financial assets is high, the ratio tends to rise.
When confidence in monetary systems, governments, debt markets or financial institutions begins to weaken, the ratio often falls as investors shift toward hard assets such as gold.
This is one reason the Dow Gold Ratio remains one of the most widely followed long-term indicators for investors interested in the relationship between shares and gold.
Where Is The Dow Gold Ratio Today?
| Date | Dow Index | Gold Price (USD) | Dow/Gold Ratio |
|---|---|---|---|
| Nov 2021 | 35,914 | $1,791 | 20.05 |
| Apr 2023 | 33,601 | $1,983 | 16.94 |
| Aug 2024 | 39,357 | $2,473 | 15.91 |
| Nov 2025 | 47,369 | $4,119 | 11.50 |
| June 2026 | 50,800 | $4,400 | 11.55 |
The decline in the Dow Gold Ratio over recent years reflects a period in which gold has generally outperformed shares, despite both assets reaching historically high valuations.
Long-Term Charts: The Big Picture
For live and interactive charts, platforms like TradingView can be useful. But long-term historical views like the one below help reveal the bigger picture.
Here’s a look at the history of the Dow to Gold Ratio going back more than a century: A 120-year view of the Dow Gold Ratio with trendlines and prediction bands:
Dow Gold Ratio Chart: 120-Year View
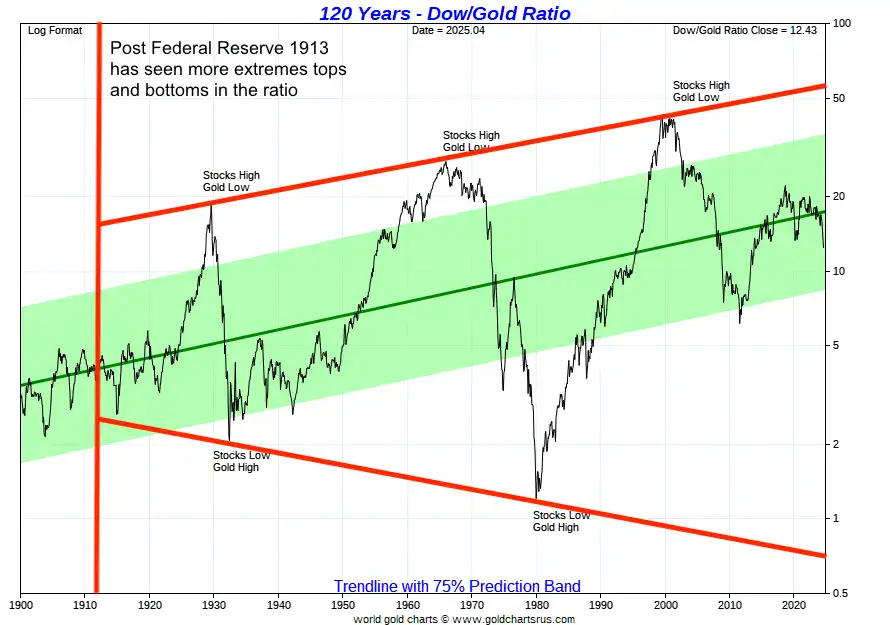
Notice how the ratio has repeatedly moved between periods where shares dramatically outperformed gold and periods where gold dramatically outperformed shares. While history never repeats exactly, these long-term cycles help explain why many investors use the Dow Gold Ratio as a tool for assessing relative value and market sentiment.
One of the most striking features of the Dow Gold Ratio is how far it can swing between extremes. At major stock market peaks, such as 1929 and 1999, the ratio reached levels above 18 and 40 respectively, reflecting strong confidence in financial assets. During major crises, such as the Great Depression and the inflationary 1970s, the ratio fell towards 1 as investors increasingly favoured gold. While future cycles may look different, the chart highlights how dramatically leadership can shift between shares and hard assets over time.
Could The Dow Gold Ratio Return To 1:1?
Historically, the Dow Gold Ratio has reached extremely low levels during major economic and monetary turning points.
For example:
- Around 1932 during the Great Depression.
- Around 1980 during the inflation and stagflation crisis.
In both cases, confidence in financial assets weakened while demand for gold increased significantly.
Some analysts believe the ratio could eventually move toward those levels again. Others argue today’s financial system is fundamentally different and that future cycles may not reach the same extremes.
The key takeaway is not whether the ratio reaches exactly 1:1.
Rather, the history of the Dow Gold Ratio demonstrates that leadership can shift dramatically between financial assets and hard assets over long periods of time.
For investors, the ratio is often most useful as a framework for understanding long-term cycles rather than as a precise forecasting tool.
Here’s a closer look at recent ratio trends since 2008:
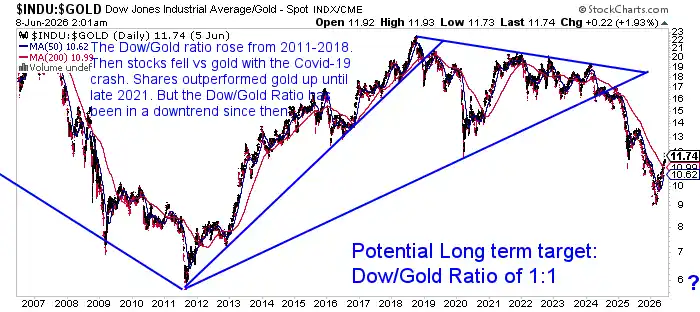
“The Dow/Gold ratio rose from 2011–2018. Then stocks fell vs gold with the Covid-19 crash. Shares outperformed gold up until late 2021. But the Dow/Gold Ratio has been in a downtrend since then.”
Source: StockCharts Annotations: Gold Survival Guide – June 2026
Related: The Gold Standard and a Free Market For Money
How to Use the Dow Gold Ratio in Your Portfolio
The Dow Gold Ratio should not be viewed as a buy-or-sell signal.
Instead, many investors use it as a tool to provide context about long-term market cycles and relative value.
The ratio may be particularly useful when:
Reviewing Asset Allocation
A very high ratio can suggest that shares have significantly outperformed gold over an extended period.
A very low ratio can suggest that gold has significantly outperformed shares.
Neither guarantees a reversal, but both may provide a reason to review whether your portfolio remains appropriately diversified.
Understanding Market Cycles
The ratio helps investors step back from short-term market noise and focus on longer-term trends.
Periods of optimism often favour financial assets such as shares.
Periods of uncertainty often increase demand for defensive assets such as gold.
Avoiding Emotional Decision Making
Many investors become most interested in an asset after it has already performed well.
The Dow Gold Ratio can help provide perspective by highlighting periods when one asset class may have become particularly popular or unpopular relative to the other.
| Ratio Range | Implication | Action |
|---|---|---|
| Above 20 | Stocks likely expensive | Consider buying more gold |
| 5–20 | Transition zone | Balanced allocation |
| Below 5 | Gold likely expensive | Consider rotating back into shares |
| ~1 | Cycle bottom | Major monetary shifts often occur |
For more on Portfolio allocation see: How Much Gold and Silver Should Be in Your Portfolio?
Limitations Of The Dow Gold Ratio
While the Dow Gold Ratio can be a useful long-term indicator, it has several important limitations.
It Is Not A Timing Tool
The ratio can remain elevated or depressed for years before reversing direction.
It Does Not Predict Short-Term Market Moves
The ratio is most useful for understanding long-term trends rather than forecasting what will happen next month or next quarter.
It Only Compares Two Assets
The ratio compares shares and gold.
It does not consider bonds, property, cash, commodities or other investments.
Economic Conditions Can Change
Past cycles provide valuable context, but there is no guarantee future cycles will follow exactly the same pattern.
For these reasons, the Dow Gold Ratio should be viewed as one tool among many rather than a standalone investment strategy.
Dow Gold Ratio vs The S&P 500
Some investors search for the relationship between gold and the S&P 500 rather than the Dow Jones Industrial Average.
The concepts are similar.
Both indices represent large US companies and can be compared to gold to assess relative performance over time.
The Dow Gold Ratio is often used because of its very long historical record stretching back more than a century, making it particularly useful for studying long-term market cycles.
For a more direct comparison of gold against shares, bonds and cash over the past 25 years, see:
Gold vs Stocks, Bonds, Cash & More: A 25-Year Showdown
FAQs on the Dow Gold Ratio
The Dow Gold Ratio measures how many ounces of gold it takes to buy the Dow Jones Industrial Average.
The exact ratio changes daily as both gold prices and share prices move. Investors often track the ratio to compare the relative performance of gold and shares over long periods of time.
The chart shows how many ounces of gold it takes to buy the Dow Jones Industrial Average.
Over time, the ratio moves in long cycles, with higher ratios generally indicating stronger share market performance relative to gold, and lower ratios indicating stronger gold performance relative to shares.
The Dow Gold Ratio uses the Dow Jones Industrial Average because it has a long historical record stretching back more than a century.
Some investors also compare gold to the S&P 500. Both approaches seek to measure the relative performance of gold versus shares over time, although the Dow Gold Ratio is generally more widely used for long-term historical analysis.
Historically, falling Dow Gold Ratios have often coincided with periods when gold outperformed shares.
However, the ratio should not be viewed as a prediction tool. It is most useful for understanding long-term trends and shifts in market leadership rather than forecasting short-term performance.
Not necessarily.
The Dow Gold Ratio is best used as a tool for understanding long-term market cycles rather than making all-or-nothing investment decisions.
Many investors use the ratio as one factor when reviewing portfolio diversification and asset allocation.
The ratio has reached approximately 1:1 during previous periods of major economic and monetary stress, including the Great Depression and the inflationary crisis of the late 1970s.
While some analysts believe it could happen again, there is no guarantee future market cycles will follow the same path. The ratio is best viewed as a framework for understanding long-term trends rather than a specific prediction.
Historically, ratios above 20 have often occurred during periods when shares were significantly outperforming gold.
High ratios can suggest shares are relatively expensive compared to gold, although they do not necessarily indicate an immediate market reversal.
Historically, ratios below 5 have often occurred during periods when gold was outperforming shares.
Extremely low ratios have sometimes coincided with major turning points in financial markets and periods of heightened economic uncertainty.
No.
While the ratio can provide useful insight into long-term market cycles, it is not designed to predict short-term movements in either gold or shares.
The ratio can remain elevated or depressed for many years before changing direction.
Although the Dow Gold Ratio uses US share market data and gold prices quoted in US dollars, the broader concepts are relevant to investors worldwide.
The ratio provides insight into long-term wealth cycles, investor sentiment and the relative performance of financial assets versus hard assets such as gold.
Final Thoughts: Understanding Long-Term Wealth Cycles
The Dow Gold Ratio is one of the simplest ways to compare the relative performance of shares and gold over time.
While it cannot predict future market movements, it can help investors understand long-term wealth cycles, changing market sentiment and periods when one asset class may be outperforming another.
History shows that leadership shifts between financial assets and hard assets over time. The Dow Gold Ratio provides a useful lens through which to view those shifts.
Whether you invest primarily in shares, gold or a combination of both, understanding these long-term cycles can help you make more informed decisions and maintain perspective during changing market conditions.
Further Reading & Tools
- Gold vs Stocks, Bonds & Cash: 25-Year Showdown
See actual returns and performance charts from 2000–2025.
Got Questions?
Have questions about your own portfolio?
Not sure how much gold is enough?
Want to understand the best way to buy and store bullion in NZ?
Free Updates
Want updates on the Dow Gold Ratio, gold price alerts, and market insights?
We’ll send you weekly updates, charts, and insights you won’t find anywhere else.
Editors Note: This post was originally published 27 June 2017. Fully updated 8 June 2026.

Glenn's dedication to educating individuals on wealth protection through precious metals has helped over 2400 clients from New Zealand, Australia, USA and Europe to safeguard their financial futures. Passionate about financial independence and lifestyle freedom, Glenn’s mission is to empower others with the knowledge and tools to thrive in today’s volatile economic environment. When he's not advising on precious metals, Glenn enjoys spending time with his family and pursuing outdoor adventures.
Education: University of Auckland Bachelor of Science
Linkedin: https://www.linkedin.com/in/glenn-thomas-0984a4310/
A fascinating comparison between gold and shares over the very long time. But surely gold has an advantage. When I purchased the gold in 1800 (I have a very long memory); I just put the coins under the mattress. The shares however had to be bought and sold to maintain a presence on the ever changing composition of the index. That would incur brokerage fees and fund management fees these days. As for taxes these would vary depending on location regarding the share trading activity..
In the case of gold as a Canadian citizen owning Maple Leaf coins I would pay no taxes if they were sold as the coins are legal tender there. In other words gold is the ideal lazy mans long term investment.
Yes good point you make Maurice that gold just needs to “sit there and do nothing” compared to other investments and as you say if you just hide it there are no storage costs. Thanks for sharing.